BIS: implications of digital currencies in central banking

Mar 14 2018

The Committee on Payments and Market Infrastructures and the Markets Committee at the Bank of International Settlement (BIS) issued a report resuming the major entanglements of digital currencies on central banking. The possibility of issuing digital currencies must be supplemented by a careful weigh of the implications both for monetary policy and stability of the financial system.

The report considers a wholesale CBDC (for use in financial markets), and a general purpose CBDC (for use by the general public). On the one hand, it finds that wholesale CBDCs might be useful for payments, although supplementary checks are needed to capture the full potential of such new mechanisms. On the other hand, wholesale CBDCs could affect the transmission of monetary policy, although it would not reshape the basic mechanism of its implementation.

Concerning general purpose CBDCs, the impact on the financial and system could be broader and larger in size. Particualrly, the intermediation activity pursued by commercial banks must be carefully accounted for. Furthermore, the reliance of such institutions on customer’s deposits might become less stable in times of stress, as it could be proner to take flight to the central bank itself.

The conclusion is that each jurisdiction considering the launch of a central banking digital currency should consider these implications thoroughly before taking any decision.

Central Bank Digital Currencies (PDF)

EIOPA consults on the IDD reviews of PII limits
di Silvia dell’Acqua

Mar 13 2018
EIOPA consults on the IDD reviews of PII limitsdi Silvia dell’Acqua

Last 30 January 2018, EIOPA published a consultation paper on the adjustments elaborated on the Insurance Distribution Directive (IDD), regarding the base amounts for Professional Indemnity Insurance (PII) and for financial capacity of the insurance intermediaries.

A PII is a form of liability insurance that covers the costs of compensating policyholders for claims, legal fees and remedies that can arise from acts, errors or omissions committed by insurance intermediaries during the conducting of their business activities. A PII not only strengthens the consumer protections by providing a source other than the firm’s capital to pay the claims, but also protects the assets of the insurance intermediaries in case of large and unexpected amounts. It is particularly valuable for small insurances and ancillary intermediaries, that might find difficult and inappropriate for their business to hold large amounts of capital. The IDD states that, regardless its size and irrespective of whether it operates in more than one Member State, to be registered and to carry on insurance intermediation, an intermediary must:

  • hold a PII covering the hole territory of the Union
    • with a level of indemnity of at least 1,250,000 euros for a single claim
    • with a level of indemnity of at least 1,850,000 euros per year for all claims
    • capital resources are not allowed as an alternative to PII
  • have a minimum financial capacity of max (18,750 euros ; 4% sum annual premiums received)

With the aim of ensuring trust in the insurance distribution, the IDD also provides for specific national options to protect customers against the inability of insurance intermediaries to pay the claim, that goes on top of the minimum requirements listed above.

Paragraph 7 of Article 10 of the IDD states that EIOPA should draft Regulatory Technical Standards (RTS) to adapt the amounts foreseen as a minimum coverage according to the changes of the European Index of Consumer Prices (EICP) published by Eurostat for the EEA in the period 01.01.2013 – 31.12.2017, reviewing the figures every five years thereafter. Although the IDD prescribes how to perform the calculations, EIOPA sees the public consultation as an important step towards a better regulation and carries it out in accordance with Article 10 of Regulation EU 1094/2010, in case of drafting a RTS. Comments can be provided by the 27th of April 2018, EIOPA is submitting the finalized RTS to the Commission by the 30th of June 2018.

EIOPA has conducted a review of different aspects of the market for PII for insurance intermediaries, concluding that:

  • there are no evidences of market failures arising from PII
  • PII is not acting as a barrier to enter the insurance intermediaries market in the EEA
  • claims for PII vary from Member State to Member State, making difficult to judge the adequacy of minimum limits
  • as the EICP increased by 4.03% (from 99.01 to 103.00), the base euro amounts for PII and financial capacity should be review as follows
    • PII level of indemnity of at least 1,300,370 euros for a single claim
    • PII level of indemnity of at least 1,924,550 euros per year for all claims
    • minimum financial capacity of max (19,510 euros ; 4% sum annual premiums received)
  • the increase of the amounts is likely increasing the cost for distributors on an ongoing basis
    • the new minimum levels of indemnity may result in a slight rise of the premiums to be paid by insurance intermediaries for their PII
    • the new minimum financial capacity may result in a potential loss of returns on investments
  • on the other hand, the increase is ensuring an adequate level of consumer protection, in line with the inflation, that ultimately increases the trust of consumers in insurance distribution.

EBA publishes a draft set of guidelines to manage NPLs

Mar 11 2018

The European Banking Authority (EBA) launched a consultation on a draft set of guidelines to properly manage non-performing exposures (NPEs), with a particular focus on non-performing loans (NPLs). The crisis left as its legacy a considerable amount of non-performing loans in banks’ balance sheets. Furthermore, a frail financial sector is more prone to suffer from new NPLs in the nearby future.

In July 2017, the European Council concluded an Action Plan to tackle non-performing loans (NPLs) in Europe. The EBA, along with other bodies and institutions, was invited by the Council to contribute to address the existing stock of non-performing loans (NPLs) as well as to prevent the emergence and accumulation of new NPEs on banks’ balance sheets.

The guidelines are designed primarily to reduce NPEs on banks’ balance sheets by providing supervisory guidance to ensure that credit institutions effectively manage NPEs and forborne exposures (FBE) in their balance sheets.

The development of an NPE strategy is the core building block of the guidelines for banks’ NPE management. The NPE strategy should be built on an assessment of the operating environment, should set out time-bound realistic, yet ambitious reduction targets and consider all available strategic options to reduce NPEs.

The guidelines outline the key elements of the governance and operations of a NPE workout framework with key aspects related to steering and decision making, the NPE operating model, internal control framework and NPE monitoring as well as early warning processes.

Credit institutions with elevated levels of NPEs should establish a NPE strategy, as part of their overall strategy, and related governance and operational arrangements. Effective governance covers all responsibilities that banks have, including to treat customers fairly.


Guidelines on NPLs (PDF)

European Supervisory Authorities jointly warn customers on virtual currencies

Mar 11 2018

The European Supervisory Authorities (ESAs) for securities (ESMA), banking (EBA), and insurance and pensions (EIOPA) issued a pan-EU report to warn consumers on the risks of buying virtual currencies. The ESAs’main concern is the increasing demand of virtual currencies by etherogeneous customers, often unaware of the underlying risks.

First of all, the price of virtual currencies is extremely volatile, and already showed signs of pricing bubbles. Customers must be warned that the consequences of large drops in prices will result in severe losses in their virtual portfolios.

Secondly, common trading platforms are not regulated under EU law, hence no protection associated to financial services is provided for EU consumers. As an example, a cyber-attack stealing virtual money from target exchange will not provide any cover to the consumers losses under the EU jurisdiction.


Furthermore, many virtual currencies exchanges have been subject to severe operational problems in the past. Consumers were not able to execute their buy/sell orders when they wanted, and suffered losses from the (high) fluctuations in such periods.

ESMA joint working on virtual currencies (PDF)

IOSCO: how to help trading venues manage extreme volatility

Mar 07 2018

The Board of the International Organization of Securities Commissions (IOSCO) is seeking feedback on its proposed recommendations to assist trading venues and regulatory authorities in the implementation of mechanisms to manage extreme volatility.

Extreme volatility in securities markets can undermine IOSCO’s objective of ensuring that markets are fair, efficient and transparent, weaken market integrity and reduce investor confidence. Following recent extreme volatility events, regulatory authorities and trading venues have been reviewing their approaches to managing extreme volatility; volatility control mechanisms seek to minimize market disruption triggered by events such as erroneous orders, by halting or temporarily constraining trading.

In the consultation report  Mechanisms Used by Trading Venues to Manage Extreme Volatility and Preserve Orderly Trading, IOSCO explores the measures that trading venues use to address the risks posed by extreme volatility. Specifical recommendations provide that:

• trading venues should have volatility control mechanisms to manage extreme volatility and that these mechanisms should be appropriately calibrated and monitored;

• regulatory authorities should consider what information they require to effectively monitor the overall volatility control mechanism framework in their jurisdiction, and make sure that trading venues maintain relevant records;

• information about volatility control mechanisms and when they are triggered should be made available to regulatory authorities, market participants and if appropriate, the public; and

• communication amongst trading venues should be considered where the same or related securities are traded on multiple trading venues in a particular jurisdiction.

(Source: IOSCO, http://www.iosco.org)


Basel III Monitoring report al 30 giugno 2017

Mar 07 2018

La Bank of International Settlement (BIS) ha pubblicato il nuovo report sull’esercizio di monitoring del comitato di Basilea III. L’esercizio si basa sui dati forniti da un totale di 193 banche, incluse 106 gruppi bancari internazionali, questi ultimi definiti come “Gruppo 1” e caratterizzati da un Tier 1 di più di 3 miliardi, a contrapporsi alle 87 istituzioni finanziarie del “Gruppo 2”, che riportano un Tier 1 di meno di 3 miliardi (o che non sono internazionalmente attive). I 30 gruppi bancari definiti di importanza sistemica globale (G-SIBs) sono stati tutti inclusi nel Gruppo 1 dell’esercizio.

I dati al 30 giugno del 2017 evidenziano che tutte le banche nel sample raggiungono il minimo di risk-based Common Equity Tier 1 (CET1) del 4.5%, e il target di CET1 del 7.0%. Tra il 31 Dicembre 2016 e il 30 Giugno 2017, le banche del Gruppo 1 hanno ridotto il proprio Tier 2 capital shortfall da 0.3 miliardi a 24 milioni di Euro.

In tema di indicatori di liquidità, la media pesata del Liquidity Coverage Ratio (LCR) nelle banche del Gruppo 1 è del 134% al 30 Giugno del 2017, in aumento del 3% rispetto al semestre precedente. Per le banche del Gruppo 2 invece, si registra un aumento medio del LCR del 16%, che si assesta al 175%. Il 99% delle banche del Gruppo 1 e tutte le banche del Gruppo 2 hanno riportato un LCR maggiore o uguale al 100%, in linea con la normativa in vigore che prevede un minimo del 90% nel 2018.

Per quanto riguarda la liquidità strutturale a lungo termine, l’indicatore di riferimento è il Net Stable Funding Ratio (NSFR). La media pesata per il Gruppo 1 e il Gruppo 2 si assesta attorno al 117% e al 118%, rispettivamente. Tutte le banche del Gruppo 1 e il 94% delle banche del Gruppo 2 hanno riportato comunque un NSFR maggiore uguale del 90%, in linea con lo standard previsto dal Comitato.

L’esercizio è stato svolto assumendo la piena attuazione del quadro di Basilea III, e non riflette alcuna misura attualmente in fase di valutazione da parte del Comitato di Basilea.

Basel Monitoring Report (full text)

Monitoring Exercises Archive

EBA pubblica il primo report sull’educazione finanziaria

Mar 07 2018
La European Banking Authority (EBA) ha pubblicato il suo primo Report sull’educazione finanziaria, che copre il biennio 2016/17. Il Report rappresenta  un’occasione di condividere esperienze per le autorità nazionali degli Stati membri, ed un’occasione di procedere appoggiandosi ad una solida base di partenza per i promotori di educazione finanziaria.
Le iniziative coperte dal Report comprendono una vasta gamma di differenti strumenti educativi, che spaziano dalle risorse online a seminari e corsi per studenti. Lo scopo è quello di aiutare i consumatori di prodotti finanziari ad approfondire la conoscenza degli strumenti che utilizzano, in linea con le direttive di Basilea.
Gli strumenti vengono valutati sulla base di quattro caratteristiche fondamentali: argomento, formato, pubblico e tipo di output prodotto. In questo modo, è possibile monitorare  i miglioramenti nell’area dell’educazione finanziaria a livello nazionale.
In questo caso, e diversamente dal suo normale mandato, l’EBA non mira all’armonizzazione all’interno dell’Unione di tali iniziative, perché diverse sono le necessità educative di ciascuno Stato.
Il Report è il risultato della raccolta di 84 iniziative di educazione finanziaria svoltesi nell’ultimo biennio. Le autorità nazionali possono per la prima volta avvalersi di un’insieme di linee guide comuni che permettano lo sviluppo di un “common sense” dei consumatori nei confronti dei prodotti finanziari.
L’educazione dei consumatori finanziari sarà dunque capillare, ma procederà a diverse velocità e su diversi livelli di approfondimento, proporzionati alle necessità di ciascuno degli Stati membri.

Link to publication (PDF)

FSB publishes Global Shadow Banking Monitoring Report 2017

Mar 07 2018

The Financial Stability Board (FSB) has published the monitoring report on shadow banking for 2017. The FSB provides a broad definition of “shadow banking” as “credit intermediation involving entities outside the regular banking system”. This intermediation, when appropriately managed, provides a reliable funding option for real economic activity. Latest financial crisis proved however that entities outside banks regulators jurisdiction are allowed to operate on a large scale, extending long term credit by means of short-term leveraged funding. This “maturity-transform” of credit might as well involve multiple transaction, yielding a chain which may unsettle financial stability.

In response to a G20 request at the Seoul Summit in 2010, the FSB adopted a two-way strategy to address potential concerns out of the shadow banking activity, and .  First, the FSB has created a system-wide monitoring framework to track developments in the shadow banking system, identifying the build-up of systemic risks and initiating corrective actions where necessary. Second, the FSB has been coordinating and contributing to the development of policies where oversight and regulation must be reinforced to mitigate the potential systemic risks associated with shadow banking.

The global monitoring of developments in the shadow banking system is part of the FSB’s strategy to transform shadow banking into resilient market-based finance. The 2017 monitoring exercise covers data up to end-2016 from 29 jurisdictions, which together represent over 80% of global GDP, including (for the first time) Luxembourg.

The exercise is activity-based rather than entity-based: the FSB focuses on those activities which are part of the non-bank financial sector and perform economic functions which might hamper financial stability.  As in previous monitoring exercises, the report compares the size and trends of financial sectors across jurisdictions based primarily on sector balance sheet data.

It then narrows the focus to those parts of non-bank credit intermediation that may pose financial stability risks (hereafter the “narrow measure of shadow banking” or “narrow measure”), based on the FSB’s methodology.

The FSB collects the main findings from the 2017 monitoring exercise as follows:

  • The activity-based, narrow measure of shadow banking grew by 7.6% in 2016 to $45.2 trillion for the 29 jurisdictions. This represents 13% of total financial system assets of these jurisdictions. China contributed $7.0 trillion to the narrow measure (15.5%), and Luxembourg $3.2 trillion (7.2%).
  • Collective investment vehicles with features that make them susceptible to runs (eg open-ended fixed income funds, credit hedge funds and money market funds), which represent 72% of the narrow measure, grew by 11% in 2016. The considerable trend growth of these collective investment vehicles – 13% on average over the past five years – has been accompanied by a relatively high degree of investment in credit products and some liquidity and maturity transformation. This highlights the importance of implementing the FSB policy recommendations on structural vulnerabilities from asset management activities published in January 2017.
  • The assets of market intermediaries that depend on short-term funding or secured funding of client assets (eg broker-dealers) declined by 3%. These intermediaries accounted for 8% of the narrow measure by end-2016. Reflecting their business models, broker-dealers in some jurisdictions employ significant leverage, although it is lower than the levels prior to the 2007-09 global financial crisis.
  • The assets of non-bank financial entities engaged in loan provision that is dependent on short-term funding, such as finance companies, shrank by almost 4% in 2016, to 6% of the narrow measure. In some jurisdictions, finance companies tend to have relatively high leverage and maturity transformation, which increases their susceptibility to roll-over risk during period of market stress.
  • In 2016, the wider “Other Financial Intermediaries” (OFIs) aggregate, which includes all financial institutions that are not central banks, banks, insurance corporations, pension funds, public financial institutions or financial auxiliaries, grew by 8% to $99 trillion in 21 jurisdictions and the euro area, faster than banks, insurance corporations and pension funds. OFI assets now represent 30% of total financial assets, the highest level since at least 2002.


(source: Financial Stability Board, www.fsb.org)

Link to publication (PDF)

Libertà di modello o modelli regulator driven? Un confronto tra PRIIPS e Basilea
di Michele Bonollo

Mar 07 2018
Libertà di modello o modelli regulator driven? Un confronto tra PRIIPS e Basileadi Michele Bonollo

La normativa sui rischi degli investimenti dei clienti: una breve sintesi

La normativa di Basilea come noto è focalizzata sulla misura dei rischi dei portafogli delle banche, siano essi finanziari (market risk), sia legati alla attività di erogazione di prestiti, mutui e fidi (credit risk). La sua è una storia ormai trentennale. Una sintesi completa è disponbile in [3].

Negli ultimi 20 anni si è sviluppato prima in ambito nazionale poi comunitario un altrettanto importante corpo normativo con le relative prassi e procedure legato alla misura dei rischi degli strumenti finanziari collocati presso la clientela. Senza pretesa di esaustività ricordiamo alcuni degli eventi normativi salienti su questo aspetto nel nuovo millennio

  • La disciplina nazionale sui FIA, fogli informativi analitici per la collocazione di obbligazioni strutturate, negli anni di grande sviluppo di questi strumenti (fine anni ’90, primi anni 2000)
  • La Direttiva Prospetto europea (cfr. [4]) sul contenuto informativo dei prospetti per il collocamento di strumenti finanziari (azioni, obbligazioni, ..)
  • La normativa MIFID (o MIFID I, cfr. [5]), che per prima ha disciplinato le esigenze di classificazione e profilazione della clientela, per fare in modo che siano rispettati opportuni vincoli di adeguatezza tra il cliente (disponibilità patrimoniale, conoscenze finanziarie, propensione al rischio) e l’investimento proposto dall’intermediario finanziario
  • La normativa UCITS IV, sui fondi comuni, che ha disciplinato il contenuto di schede stadardizzate di informazione su costi, composizione e rischi degli OICR, requisti organizzativi, si veda [6]

A queste normative di primo livello sono corrisposte negli anni normative di II e III livello, tra cui in particolare le circolari e regolamenti Consob-Bankit.

Ricordiamo in particolare, con i suoi numerosi aggiornamenti, il regolamento congiunto Consob-Bankit ([7]) sui servizi di investimento e di gestione del risparmio, che disciplina in modo molto preciso anche le attività in carico alle funzioni di controllo delle banche (risk mgt, compliance, audit) sulla conformità alle normative dei processi aziendali di costruzione e collocamento dei prodotti e servizi.

In ambito extra normativo, però con effetti significativi in termini di dottrina e procedure, va ricordato il Quaderno Consob 63 (si veda [8]), per il dibattito suscitato in relazione all’uso di scenari probabilistici (contrapposti a un approccio what if) per la descrizione dei rischi degli investimenti.

Ricordiamo infine l’attività realizzata per alcuni anni da ABI con Patti Chiari sulle obbligazioni strutturate. Attività di pubblico servizio che ha prestato il fianco a numerose critiche, in quanto in sostanza catturava e misurava il rischio di mercato di uno strumento, ma non il rischio di default, o questo era troppo ancorato al rating. Questo dal caso dei bond Parmalat passando per il default Lehman sino ai bond subordinati (Popolare Etruria, ecc) ha portato alla fine alla chiusura del servizio, anche se il portale web è ancora nominalmente attivo.

Su questa storia articolata e in parte disomogenea tra il mondo degli strumenti di base (azioni, obbligazioni) e quello del risparmio gestito (fondi, sicav, prodotti assicurativi con contenuto finanziario quali le polize index e unit linked) si innestano dal 2.1.2018 due normative di fondamentale importanza: MIFID 2 e PRIIPS.

MIFID 2 rafforza gli strumenti di tutela del cliente, esprimendo nuovi concetti quali la product governance (l’intermediario deve avere presente e dichiarare il target di riferimento del prodotto), dall’altro rendendo più rigidi principi già stabiliti in MIFID, quali i casi di esonero dell’intemediario da responsabilità in regime di execution only, o i criteri di preparazione professionale dei dipendenti impegnati in servizi di consulenza.

La normativa PRIIPS (si veda [10]), detta anche “KID for PRIIPS”, disciplina il documento standard KID (key information document) per i prodotti finanziari retail e insaurance based, con le informazioni che deve recare in 3 pagine, altamente standardizzate, in ordine a:

  • Struttura generale del prodotto e dati anagrafci
  • Costi
  • Scenari di performance
  • Rischi

Importante da subito osservare cosa rientra nel perimetro dei PRIIPS, come dalla tabella che segue:

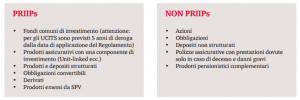
Come riportato in tabella, i fondi comuni già sottoposti a UCITS hanno 5 anni di deroga, ma verosimilmente il loro documento standard, che nel gioco delle “i” si chiama “KIID”, sarà riportato alle regole del “KID”.


Le Misure di Rischio. Una generalizzazione concettuale

E’ opinione diffusa non corretta che fare Risk Management sia quasi esclusivcamente una questione di scelta modello probabilistico per l’evoluzione dei mercati, quindi dei prezzi e dei fattori di rischio, e di scelta della misura per tradurre in senso numerico il termine “rischio”. In tal senso ha forse nuociuto la discussione ventennale nella comunità finanziaria tra VaR (un quantile) ed Expected Shortfall (la media della perdita sui soli casi estremi), che ha messo in secondo piano altri aspetti essenziali del processo di controllo del rischio. Cerchiamo di astrarre dai casi specifici per rappresentare nel seguito tutti gli elementi di tale processo.

  • Misura teorica. Si è già detto di questo, e come noto nel market risk sono VaR ed ES i due pincipali competitors. Ma molte altre sono le proposte possibili con buona diffusione nella prassi. Per esempio, la volatilità stessa è un popolare indicatore di rischio nel campo dell’asset management. Sempre nell’asset management, si usano spesso misure ex-post quali max drawdown, cioè la massima escursione negativa di un prezzo in un dato periodo. Oppure vanno ricordate le misure di decomposizione del rischio. Per esempio il ComponentVaR misura in che parte uno strumento o sub-portafoglio contribuisce al VaR dell’intero portafoglio. Infine anche gli stress test sono una misura di rischio. Negli stress test la logica probabilistica viene sostituita da un approccio what if, cioè quanto si perde nell’investimento se una evento estremo si verificasse, evento a cui non necessariamente viene attribuita una probabilità. A questo approccio sono collegate misure molto diffuse in ambito gestionale nei portafogli proprietari delle banche, si pensi alla duration o al bpv (basis point value), cioè di quanto cambia il valore di una posizone/portafoglio se la curva dei tassi si sposta di 0.01%. Misure molto utili anche per coperture in base al “rischio aperto”
  • Parametri della misura. Con che parametri viene applicata la misura? Nel caso del VaR i parametri tipici sono l’orizzonte (holding period) e il livello di confidenza Questi parametri riflettono il livello di prudenza che il regulator o le prassi gestionali usano per dare concretezza al concetto di rischio. Esempio: mentre nel rischio di mercato la normativa Basilea II-III richiede un livello di confidenza del 99%, nel rischio di credito per i modelli interni è richiesto un VaR al 99.9%, anche per tenere conto di possibili incertezze sui parametri, rischio modello, ecc. Al contrario in ottica gestionale non è infrequente l’uso di un VaR con livello 95%. Ci si preoccupa cioè di livelli di perdite con un livello di prudenza/pessimismo più moderato.
  • Modello probabilistico del mercato. Questo aspetto ha a che fare con la dinamica dei prezzi degli strumenti finanziari o dei fattori di rischio che compongono il portafoglio. Se si calcola il VaR utilizzando i punti za della variabile gaussiana, è perché si ipotizza una distribuzione gaussiana dei rendimenti. Se viceversa si applicano ai valori correnti i rendimenti storici e poi si determina il quantile empirico dela distribuzione dei valori, si è nel caso opposto di approccio non parametrico (più noto nel settore come historical simulation), cioè non si fa alcuna ipotesi sulla forma dei rendimenti e si considera che il loro istogramma empirico ne sia la migliore stima
  • Algoritmo calcolo della misura. Fissati gli elementi precedenti, quindi a parità di misura e di modello, ci possono essere differenti metodi di calcolo della stessa, per questioni di proprietà statistiche nell’ ultimo step del calcolo. Esempio: Se si usano i metodi di historial simulation o simulazione montecarlo e si dispone di 473 osservazioni, il VaR 99% potrebbe essere stimato campionando il 4^ peggiore risultato, il 5^ peggiore, cioè con delle stime empiriche in un caso più prudente e nell’altro più fair del quantile teorico. Oppure visti i noti problemi di instabilità (elevata varianza) dei quantili empirici “puntuali”, si può utilizzare una media pesata del 4^ e 5^ peggiori scenari o in un intorno ancora più ampio.
  • Scomposizione/granularità della misura. Spesso in letteratura accademica è normale scrivere “Il VaR” o “L’expected shortfall”. Ma sarebbe più corretto scrivere “I VaR”. In altri termini, fissata la misura questa viene calcolata in condizioni e aggregati differenti. Esempi: nella normativa di Basilea le asset class (tasso, cambi, equity) determinano una pluralità di misure, in cui il rischio viene analizzato congiuntamente ma anche con riferimento al distinto contributo delle diverse asset class. Sia nei portafogli proprietari sia nel risparmio gestito si calcolano misure di rischio sul singolo strumento/posizione sia sull’intero portaffoglio o sub-portafoglio. La futura normativa sui rischi di mercato, FRTB, richiede di calcolare ES su tutte le possibili combinazioni di asset class e liquidity horizon secondo la tassonomia assegnata ai fattori di rischio.
  • Scopo della misura. Una misura senza alcun feedback nei processi ma solo rappresentata nel reporting sarebbe poco utile, si tratterebbe poer l’appunto solo di misura senza “controllo” o “gestione”. Possiamo distinguere i seguenti utilizzi delle misure:
    • Adeguatezza patrimoniale (Basilea). Si verifica cioè se il patrimonio della banca può sopportare le perdite potenziali stimate con le misure di rischio
    • Adeguatezza/Classificazione (MIFID/PRIIPS). Lo strumento in base alla sua misura numerica è classificato in diverse classi (7 nella normativa PRIIPS), e questo permette di verificare in termini di compliance se lo strumento o l’intero portafoglio è adeguato per il profilo del cliente
    • Limiti (gestionale). Le banche nei portafogli proprietari e gli asset managers (nei prospetti o con limiti interni) fissano vari limiti di massimo rischio in capo ai diversi livelli di reponsabilità nella gestione del portafoglio, un vero e proprio albero dei limiti. All’eventuale mancato rispetto di questi limiti sono legati processi di rientro (cioè chiudere le posizioni per rientrare nel limite) o di approvazione, mediante un processo di escalation gerarchica che in relazione ai vari casi può richiedere l’intervento dei vertici apicali o del CDA.


Confronto tra misura dei rischi finanziari Basilea vs PRIIPS

In che misura i processi di Risk Management regolamentari, per compliance alle diverse regulattion, sono liberi di effettuare le scelte interne? O si tratta di processi regulator driven con stretti obblighi di compliance? Rispetto agli elementi descritti nel paragrafo precedente, riportiamo una tabella di confronto tra la normative di Basilea, ambito market risk, e PRIIPS.

Drivers Controllo rischio PRIIPS BASILEA
Misura rischio Value at Risk Value at Risk attualmente, Expected Shortfall nella normativa FRTB
Parametri misura Confidence level a = 97.5%, poi questo dato viene ricondotto a una VEV = volatilità annualizzata. Infine viene anche definito RHP = reccomended holding period Confidence level a = 99%, Holding Period h = 10 days. Poi mediante coefficiente moltiplicativo b la misura è riscalata (Beta tra 3 e 4)
Algoritmo di calcolo Regulation given. Per i prodotti lineari (senza garanzie capitale o opzionalità) si utilizza l’approssimazione del quantile di CornishFischer. Per prodotti con payoff non lineari va effettuata una simulazione montecarlo con 10.000 paths su cui poi stimare il quantile Le banche possono utilizzare qualunque modello: modello non parametrico (historical simulation) o parametrico (tipicamente gaussiano) per i fattori di rischio, o anche approssimazioni analitiche come le delta-gamma-vega. La qualità predittiva del modello è monitorata con backtesting delle P&L effettive vs il VaR ex ante.
Scomposizione Segmentazione Il VaR del prodotto non è decomposto. I prodotti sono però classificati in 4 categorie con regole di calcolo diverse: 1) prodotti complessi (e.g. derivati) o senza serie storiche 2) Prodotti lineari (e.g. unit linked e fondi plain) 3) Prodotti non lineari (e.g. prodotti con garanzia capitale) 4) Prodotti che dipendono da parametri non osservabili (e.g. da indicatori bilancio dell’azienda emittente) L’enfasi è sul rischio di portafoglio, non della singola posizione. Questo è però decomposto (con somma finale senza effetto diversificazione) in asset class come segue: rischio di tasso, rischio spread, rischio equity, rischio forex, rischio commodity. Nella normativa FRTB di futura applicazione oltre alle asset class (AC) si tiene conto dei liquidity horizon (LH), con un set più granulare di segmentazione della misura
Scopo misura Al prodotto viene assegnata una classe di rischio finanziario tra 1 e 7 (massimo rischio) in base ad altrettanti classi di volatilità. Qesta va poi confrontata con il profilo di rischio del cliente per verificare l’adeguatezza cioè la compatibilità con il suo portafoglio. La misura di rischio di mercato, oggi data da VaR e VaR stressato moltiplicato per coefficiente beta, viene sommata al rischio di credito e operativo. La somma dei rischi deve essere minore o uguale agli own funds (patrimonio della banca) in base al primo pilastro di basilea, che prescrive che debba essere il patrimonio a fare fronte alle perdite (estreme), di cui la misura dei rischi fornisce una stima ex ante.


Riflessioni e Conclusioni

A parte le intuibili differenze nell’utilizzo pratico delle misure di rischio e nella segmentazione delle stesse, la vera differenza significativa nel confronto Basilea vs PRIIPS è che nel contesto PRIIPS non solo la misura ma anche il modello/algoritmo, sino alla lunghezza delle serie storiche richieste per la stima dei parametri, è totalmente prescritto dal regulator.

In questo ravvisiamo alcuni razionali comprensibili. Se la tutela di tutti gli stakeholder in particolare depositanti è importante nella verifica di consistenza del patrimonio delle banche (Basilea), ancora di più 15 anni di gravi casi di perdite subite dai clienti nei loro portafogli per mancata tutela suggeriscono una normativa molto dirigistica in ogni dettaglio del calcolo. Questo in relazione alla alea da modello che anche nel contesto di “Basilea 4” sta portando a ridurre l’autonomia dei modelli interni.

Sul fronte dei punti di attenzione, le 4 categorizzazioni previste in PRIIPs con altrettante tecniche di misura hanno punti di confine non sempre chiarissimi nella loro effettiva applicazione. Inoltre, su un piano strettamente tecnico, appare in alcuni casi debole (cioè per alcune distribuzioni dei rendimenti) l’uso della approssimazione analitica del quantile con il metodo di Cornish-Fiscer, si veda [11].

Certo si doveva regolamentare e l’impianto generale è rigoroso e fair. Vedremo nei prossimi mesi in che misura anche le reti di di vendita e consulenza sapranno migliorare e rendere più sostanziale la relazione con il cliente con questi nuovi KIDs.


References

[1] Basel Committee on Banking Supervision (2014), “Fundamental review of the trading book: outstanding issues”, paper 305.

[2] Basel Committee on Banking Supervision (2016), “Minimum capital requirements for market risk,”, paper 307.

[3] Bonollo M. (2017), “30 anni del percorso della regolamentazione di Basilea. Un tentativo di sintesi”, https://www.finriskalert.it/?p=5161.

[4] European Parliament (2003), “Directive 2003/71/EC – prospectus to be published when securities are on sale to the public or admitted to trading”, Official Journal of the European Union.

[5] European Parliament (2004), “Directive on markets in financial instruments 2004/39”, Official Journal of the European Union.

[6] European Parliament (2009), “UCITS IV, regulation 2009/65”, Official Journal of the European Union

[7] Consob-Bankit (2007), “Regolamento in materia di organizzazione e procedure degli intermediari che prestano servizi di investimento o di gestione collettiva del risparmio (Testo integrato e aggiornato al 20 marzo 2015)”.

[8] Minenna M. et al. (2009) “Un approccio quantitativo risk-based per la trasparenza dei prodotti d’investimento non-equity”, Quaderni di Finanza Consob, n.63.

[9] European Parliament (2013), “Capital requirement regulation n.575” (Basel III)”, Official Journal of the European Union.

[10] European Parliament (2014), “Regulation 1286/2014 \Key information documents for packaged retail and insurance-based investment products (PRIIPs)”, Official Journal of the European Union.

[11] Tesser M. et al (2017), \Packaged Retail Investment and Insurance-based Investments Products (PRIIP) – Scenari di performance con traiettorie alla Cornish-Fisher”, Working Paper Department of Economics, University of Verona WP, n.11.


Asset purchase programmes: stock or flow effect?

Feb 26 2018

Benoit Coeuré, member of the executive board of the ECB, addressed the annual US Monetary Policy Forum which took place in New York on February, 23rd. Coeuré focused on assets purchase programme, which reached unprecedently high levels in recent years.

Particularly, he addresses the question on whether it is the cumulated stock or the quarter-by-quarter flow of such purchases affecting the price of the underlying obligations. This question is particularly important for the ECB, as the assets purchase programmes comprise three components: first, net asset purchases; second, the stock of acquired assets and forthcoming reinvestments; and third, an ECB forward guidance on interest rates.

The detailed evidences supplied reveal the non-linear nature of the stock effect, which implies that the amount of purchases needed to compress the term premium is likely to fall over time, as the cumulated amount of stock increases. There exists a threshold (“crossover point”) then additional purchases become less necessary.

  Figure 1  :  A stylized representation of stock effects 

(Source: ECB)

The underlying theoretical reasoning is relatively simple: asset purchase programmes consists of an inelastic demand of obligations from the central bank (D_CB in Figure 1). This demand constrains de facto the supply of bonds available to price-sensitive private investors. The demand curve for private investors, is price-elastic. Hence, if central banks have succeeded in shifting the supply curve sufficiently inwards, that is, the price variation induced by investors’ demand (D in Figure 1) will get smaller, then prices may become less sensitive even when purchases start being reduced. The full speech is available in the ECB website.

The persistence and signalling power of central bank asset purchase programmes (link)