Insights from the Energy Finance Italia 8 (EFI 8) Conference
a cura di Davide Stocco

Mar 05 2023
Insights from the Energy Finance Italia 8 (EFI 8) Conference a cura di Davide Stocco

The EFI 8 – Energy Finance and Climate Change Conference brought together experts and professionals from the energy and finance sectors to discuss the latest trends and challenges in the industry. The conference, held at Politecnico di Milano from the 8th to the 10th of February, featured a program that has explored the energy financial sector through mathematical finance models. The conference also commemorated Professor Peter Laurence for his work in quantitative finance, specifically in the energy field.

Just a few numbers: more than 100 participants during the three days of conference, coming from 34 universities and research centres, 14 countries represented, 14 leading companies in the sector involved. The event featured 46 presenters and 3 superlative keynote speeches from Clémence Alasseur, Fred Espen Benth, and Florian Ziel.

Clémence Alasseur has presented “A Rank-Based Reward between a Principal and a Field of Agents: Application to Energy Savings”, a work which tackles the problem of designing a reward function to a field of heterogeneous agents in order to stimulate their energy savings. In the proposed setting, the agents compete with each other through their rank within the population to obtain the best reward. She first obtains explicitly the equilibrium for the mean-field game played by the agents, and then characterizes the optimal reward in the homogeneous setting. For the general case of a heterogeneous population, she develops a numerical approach, which is then applied to the specific case study of the market of Energy Saving Certificates.

Fred Espen Benth has given a talk on “Recent advances on forward curve modeling and applications”. He presents infinite-dimensional stochastic volatility models, including leverage, and discusses the question of option pricing in this context. Neural networks in Hilbert spaces provide an attractive numerical method to price options on forward curves, where stylized structures of the curves are used as additional information in the training. Finally, he presents new limit theorems on the realized variation of forward curves, which can be used for estimation.

Florian Ziel has presented “Electricity price forecasting: Data science meets fundamental models” There are two structurally different model approaches in the literature: i) data science models, which evaluate historical price and external data, and ii) fundamental models, which model the electricity price economically using supply and demand approaches. First, he discusses advantages and disadvantages of both modeling approaches. Then, he considers several options on how to combine and intertwine the two modeling approaches to improve model performance and forecast accuracy. This talk has shown how data scientists should learn from fundamental modelers and vice versa.

The conference also featured a Best Paper Award, which was won by Alexander Blasberg for his paper, “Carbon Default Swap – Disentangling the Exposure to Carbon Risk Through CDS.” The paper explored the exposure to carbon risk through CDS, offering valuable insights for investors and finance professionals. The paper is coauthored by Luca Taschini and Kiesel Rudiger.

The conference has also dedicated some sessions to ESG and climate change research. This research highlighted the importance of sustainable finance and innovative models to support the growth of renewable energy.

The EFI 8 Conference has provided a platform for experts and professionals to exchange ideas and insights on the latest trends and challenges facing the industry. As the world continues to face the challenges of climate change and the energy transition, conferences like this are crucial in shaping the future of energy finance.

Website: https://www.energyfinanceitalia.it/

LinkedIn: https://t.ly/uJG_

Slide of the presentations: https://www.energyfinanceitalia.it/speakers/

Indice di turbolenza dei mercati (28 febbraio 2023)

Mar 03 2023
Indice di turbolenza dei mercati (28 febbraio 2023)

a cura di Gianni Pola e Antonello Avino

Gli indici utilizzati sono:

Questa immagine ha l'attributo alt vuoto; il nome del file è Immagine-4.png

Le volatilità riportate sono storiche e calcolate sugli ultimi 30 trading days disponibili. Per ogni asset-class dunque sono prima calcolati i rendimenti logaritmici dei prezzi degli indici di riferimento, successivamente si procede col calcolo della deviazione standard dei rendimenti, ed infine si procede a moltiplicare la deviazione standard per il fattore di annualizzazione.

Per il calcolo della distanza di Mahalnobis si procede dapprima con la stima della matrice di covarianza tra le asset-class. Si considera l’approccio delle finestre mobili. Come con la volatilità, si procede prima con il calcolo dei rendimenti logaritmici e poi con la stima storica della matrice di covarianza, come riportato di seguito.

Supponendo una finestra mobile di  T periodi, viene calcolato il valore medio e la matrice varianza covarianza al tempo t come segue:

Questa immagine ha l'attributo alt vuoto; il nome del file è image-6.png

La distanza di Mahalanobis è definita formalmente come:

Questa immagine ha l'attributo alt vuoto; il nome del file è image-7.png

Le parametrizzazioni che sono state scelte sono:

  • Rilevazioni mensili
  • Tempo T della finestra mobile pari a 5 anni (60 osservazioni mensili)

Le statistiche percentili sono state calcolate a partire dalla distribuzione dell’indicatore di Mahalanobis dal Dicembre 1997 al Dicembre 2019 su rilevazioni mensili.

Ulteriori dettagli sono riportati in questo articolo.

Disclaimer: Le informazioni contenute in questa pagina sono esclusivamente a scopo informativo e per uso personale. Le informazioni possono essere modificate da finriskalert.it in qualsiasi momento e senza preavviso. Finriskalert.it non può fornire alcuna garanzia in merito all’affidabilità, completezza, esattezza ed attualità dei dati riportati e, pertanto, non assume alcuna responsabilità per qualsiasi danno legato all’uso, proprio o improprio delle informazioni contenute in questa pagina. I contenuti presenti in questa pagina non devono in alcun modo essere intesi come consigli finanziari, economici, giuridici, fiscali o di altra natura e nessuna decisione d’investimento o qualsiasi altra decisione deve essere presa unicamente sulla base di questi dati.

Borsa: dopo un anno di guerra, Europa in rialzo con Milano a +8%, listini USA in rosso

Feb 25 2023

Gas -57%, petrolio cede il 18%. Euro in flessione del 5,8%. Dopo un anno dall’invasione russa in Ucraina, le Borse europee sono in rialzo rispetto al giorno in cui i carri armati di Mosca sono entrati nel territorio di Kiev, Wall Street mostra un bilancio in rosso, petrolio e gas sono tornati a scendere e la Borsa di Mosca appare “vincente”. E’ disomogeneo per i mercati internazionali il bilancio del primo anno di guerra…

https://www.borsaitaliana.it/borsa/notizie/radiocor/prima-pagina/dettaglio/borsa-dopo-un-anno-di-guerra-europa-in-rialzo-con-milano-a-8-listini-usa-in-rosso-nRC_24022023_1906_563113635.html

Financial statements of the ECB for 2022

Feb 25 2023

The European Central Bank’s (ECB’s) audited financial statements for 2022 show that the ECB’s profit was zero (2021: €192 million) and thus there will be no profit distribution to the euro area national central banks (NCBs). This result takes into account a release of €1,627 million from the provision for financial risks to cover losses incurred during the year. These losses…

https://www.ecb.europa.eu//press/pr/date/2023/html/ecb.pr230223~398b74f1dc.en.html

EU carbon hits 100 euros taking cost of polluting to record high

Feb 25 2023

The price of permits on the European Union’s carbon market hit 100 euros ($106.57) per tonne for the first time on Tuesday, a milestone that reflects the increased costs that factories and power plants must pay when they pollute. The benchmark EU Allowance (EUA) contract rose to a high of 101.25 euros per tonne and was trading at 100.49 euros per tonne by 15.49 GMT. EUAs are the main currency…

https://www.reuters.com/markets/carbon/europes-carbon-price-hits-record-high-100-euros-2023-02-21/

G20 Roadmap for Enhancing Cross-border Payments: Priority actions for achieving the G20 targets

Feb 25 2023

Since G20 Leaders endorsed the Roadmap for Enhancing Cross-border Payments in 2020, much has been accomplished through the necessary stocktakes and analyses. Quantitative targets were established to meet the roadmap’s ambition for achieving cheaper, faster, more transparent, and more accessible cross-border payments. During these first two years of the Roadmap…

https://www.fsb.org/2023/02/g20-roadmap-for-enhancing-cross-border-payments-priority-actions-for-achieving-the-g20-targets/

Il termometro dei mercati finanziari (24 Febbraio 2023)
a cura di E. Barucci e D. Marazzina

Feb 25 2023
Il termometro dei mercati finanziari (24 Febbraio 2023)a cura di E. Barucci e D. Marazzina

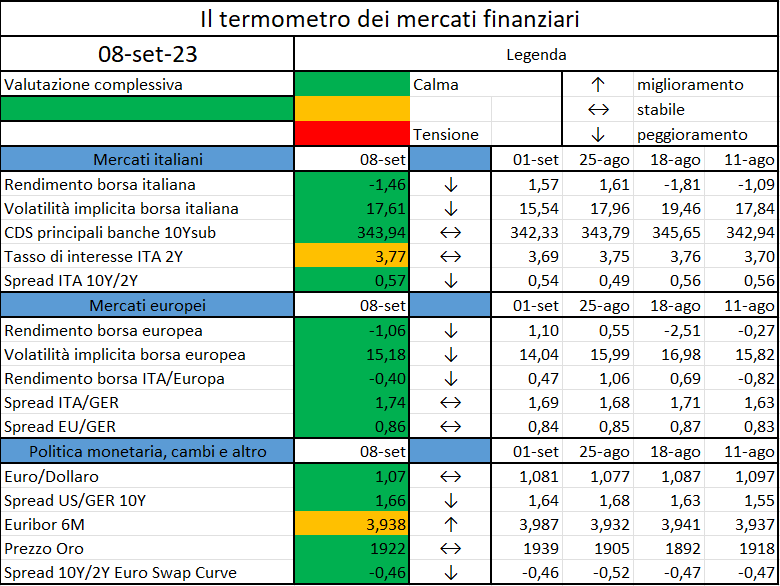
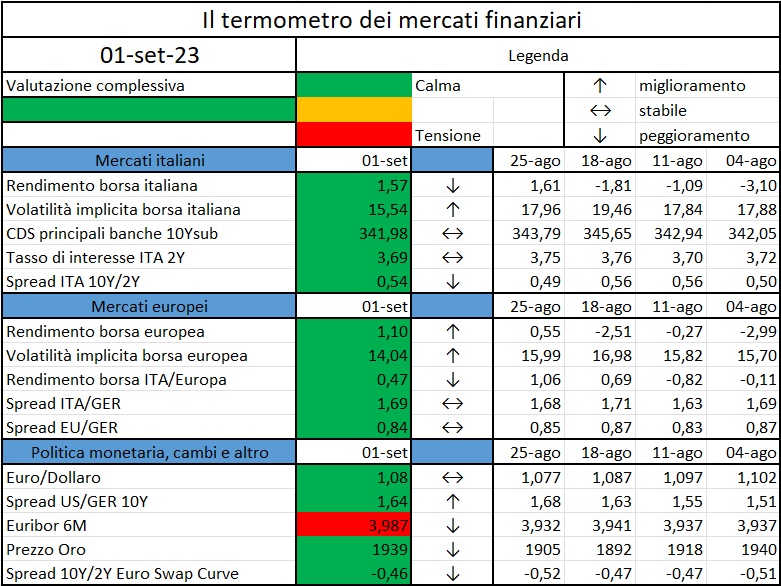
L’iniziativa di Finriskalert.it “Il termometro dei mercati finanziari” vuole presentare un indicatore settimanale sul grado di turbolenza/tensione dei mercati finanziari, con particolare attenzione all’Italia.

Significato degli indicatori

  • Rendimento borsa italiana: rendimento settimanale dell’indice della borsa italiana FTSEMIB;
  • Volatilità implicita borsa italiana: volatilità implicita calcolata considerando le opzioni at-the-money sul FTSEMIB a 3 mesi;
  • Future borsa italiana: valore del future sul FTSEMIB;
  • CDS principali banche 10Ysub: CDS medio delle obbligazioni subordinate a 10 anni delle principali banche italiane (Unicredit, Intesa San Paolo, MPS, Banco BPM);
  • Tasso di interesse ITA 2Y: tasso di interesse costruito sulla curva dei BTP con scadenza a due anni;
  • Spread ITA 10Y/2Y : differenza del tasso di interesse dei BTP a 10 anni e a 2 anni;
  • Rendimento borsa europea: rendimento settimanale dell’indice delle borse europee Eurostoxx;
  • Volatilità implicita borsa europea: volatilità implicita calcolata sulle opzioni at-the-money sull’indice Eurostoxx a scadenza 3 mesi;
  • Rendimento borsa ITA/Europa: differenza tra il rendimento settimanale della borsa italiana e quello delle borse europee, calcolato sugli indici FTSEMIB e Eurostoxx;
  • Spread ITA/GER: differenza tra i tassi di interesse italiani e tedeschi a 10 anni;
  • Spread EU/GER: differenza media tra i tassi di interesse dei principali paesi europei (Francia, Belgio, Spagna, Italia, Olanda) e quelli tedeschi a 10 anni;
  • Euro/dollaro: tasso di cambio euro/dollaro;
  • Spread US/GER 10Y: spread tra i tassi di interesse degli Stati Uniti e quelli tedeschi con scadenza 10 anni;
  • Prezzo Oro: quotazione dell’oro (in USD)
  • Euribor 6M: tasso euribor a 6 mesi.
  • Spread 10Y/2Y Euro Swap Curve: differenza del tasso della curva EURO ZONE IRS 3M a 10Y e 2Y;

I colori sono assegnati in un’ottica VaR: se il valore riportato è superiore (inferiore) al quantile al 15%, il colore utilizzato è l’arancione. Se il valore riportato è superiore (inferiore) al quantile al 5% il colore utilizzato è il rosso. La banda (verso l’alto o verso il basso) viene selezionata, a seconda dell’indicatore, nella direzione dell’instabilità del mercato. I quantili vengono ricostruiti prendendo la serie storica di un anno di osservazioni: ad esempio, un valore in una casella rossa significa che appartiene al 5% dei valori meno positivi riscontrati nell’ultimo anno. Per le prime tre voci della sezione “Politica Monetaria”, le bande per definire il colore sono simmetriche (valori in positivo e in negativo). I dati riportati provengono dal database Thomson Reuters. Infine, la tendenza mostra la dinamica in atto e viene rappresentata dalle frecce: ↑,↓, ↔  indicano rispettivamente miglioramento, peggioramento, stabilità rispetto alla rilevazione precedente.

Disclaimer: Le informazioni contenute in questa pagina sono esclusivamente a scopo informativo e per uso personale. Le informazioni possono essere modificate da finriskalert.it in qualsiasi momento e senza preavviso. Finriskalert.it non può fornire alcuna garanzia in merito all’affidabilità, completezza, esattezza ed attualità dei dati riportati e, pertanto, non assume alcuna responsabilità per qualsiasi danno legato all’uso, proprio o improprio delle informazioni contenute in questa pagina. I contenuti presenti in questa pagina non devono in alcun modo essere intesi come consigli finanziari, economici, giuridici, fiscali o di altra natura e nessuna decisione d’investimento o qualsiasi altra decisione.

La lunga strada per regolare il mondo delle criptovalute prima che si autodistrugga
a cura di Emilio Barucci per Huffington Post

Feb 25 2023
La lunga strada per regolare il mondo delle criptovalute prima che si autodistruggaa cura di Emilio Barucci per Huffington Post

Il mondo delle criptovalute non conosce pace.

Nonostante Bitcoin sia rimbalzato nel nuovo anno, quasi +50% sul minimo raggiunto nel 2022, le magagne continuano a venire a galla coinvolgendo perlopiù l’anello debole rappresentato dagli Exchange (dove si scambiano euro con criptovalute): dopo FTX su scala globale è il turno della piattaforma italiana The Rock Trading a sospendere le operazioni per problemi di liquidità.

E’ di questi giorni la notizia che la SEC (l’autorità americana di controllo sui mercati) ha accusato Terraform Labs PTE Ltd e il suo fondatore Do Kwon di aver orchestrato una frode multimiliardaria legata alla stablecoin algoritmica Terra-Luna che è andata in crash lo scorso maggio. Si trattava della quarta stablecoin, con una capitalizzazione di 18 miliardi di dollari che si sono volatilizzati nel giro di una settimana.

Non si tratta qui di stare a discutere se Bitcoin abbia valore o meno, è indubbio che la moneta digitale per eccellenza abbia mostrato una salute inaspettata. Chi si aspettava che il 2022 sarebbe stato l’inizio della fine è stato smentito per il momento. Il problema è rappresentato dall’industria che ci sta dietro che sfugge alla regolazione e, in molti casi, si fonda su un vero e proprio schema Ponzi come quello messo in piedi, in tempi recenti, nella finanza tradizionale da Bernie Madoff che ha coinvolto oltre 37000 risparmiatori causando perdite per oltre 60 miliardi.

In sintesi lo schema funziona così: attrarre investitori promettendo rendimenti elevati, onorare gli impegni contando di ricevere nuovi fondi, da altri investitori, o sul fatto che il valore dell’investimento cresca. Facendola breve, le promesse nei confronti degli investitori vengono mantenute con i fondi ottenuti da altri investitori o dalla crescita degli asset su cui sono investiti i loro denari. Tutto funziona se il numero di investitori continua a crescere e il mercato cresce, se uno di questi due ingredienti viene meno, il giochino si inceppa.  

Gli Exchange sfruttano questo schema permettendo agli investitori di operare a leva, cioè a dire prendendo le criptovalute a prestito da altri investitori, il livello di leva in alcuni casi è superiore anche di 100 volte al capitale investito. Per alimentare questo processo, che porta ad un incremento del prezzo delle criptovalute, gli Exchange propongono ai loro clienti di non trasferire gli asset digitali presso i loro wallet sulla blockchain ma di lasciarli in deposito presso di loro, e in cambio promettono loro un elevato rendimento.

E’ un po’ quello che succede quando lasciamo i nostri soldi in deposito presso una banca. Di fatto gli Exchange sono una banca, ma c’è una differenza importante: non sono sottoposti alla vigilanza delle autorità. E’ una differenza non da poco: se la banca fallisce siamo garantiti fino a 100.000 euro di ricevere i nostri denari indietro e la Banca Centrale Europea e la Banca d’Italia vigilano sulla solidità dell’intermediario, se l’Exchange fallisce non abbiamo alcuna garanzia di ricevere i nostri denari indietro e nessuno ci dice se l’Exchange sia solido o meno. Senza dimenticare che molti Exchange o società che stanno dietro alle criptovalute hanno sede in paesi lontani, Barbados nel caso FTX e Singapore nel caso Terra-Luna, rendendo molto difficile la possibilità di farsi valere.     

Anche il crash della stablecoin Terra-Luna affonda le sue radici in questo meccanismo, il protocollo Anchor (che è l’oggetto delle attenzioni della SEC) prometteva il 20% di rendimento su base annua a chi permetteva che i propri tokens Terra fossero utilizzati per operazioni a leva. L’ammontare di asset destinati a questo scopo è cresciuto del 3000% ne giro di un anno ed è giunto ad essere il 75% della totalità dei tokens Terra in circolazione. Il gioco ha funzionato finché le criptovalute sono cresciute, nel momento in cui sono scese il giochino si è rotto da sé o, forse, è stato oggetto di una attacco concertato speculativo.

Le autorità di regolazione si stanno muovendo con un ritardo che è sotto gli occhi di tutti. Non si contano negli ultimi anni gli appelli per una maggiore regolazione del mondo delle criptovalute. Passare dalle parole ai fatti è stato difficile e sta richiedendo tempi biblici. Anche nell’immediato non sembra che cambierà molto.

La regolazione promossa a livello europeo su Mercati in cripto assets entrerà in vigore nel 2023 ma ci vorrà del tempo per la sua implementazione. La regolazione introduce regole per gli operatori di piattaforme basate su tecnologie blockchain che permettono la negoziazione di asset digitali, introduce l’obbligo di richiedere l’autorizzazione ad operare, un regime di sorveglianza per gli emittenti di stablecoin, regola l’emissione di assets digitali e la fornitura di servizi relativi a cripto assets. Negli Stati Uniti la regolazione è ancora più indietro anche a causa dell’intensa attività di lobby del mondo delle criptovalute. Il Financial Stability Board ha promosso una consultazione per la regolamentazione di questi mercati e intende definire una serie di raccomandazioni nel 2023 secondo il principio ‘‘same risk, same regulation’’. Il Comitato di Basilea ha promosso una serie di raccomandazioni per la supervisione degli intermediari circa le loro esposizioni in cripto assets. La richiesta è che le banche soddisfino dei requisiti prudenziali in linea con l’impostazione di Basilea riguardo ai loro investimenti in criptovalute, l’implementazione delle misure dovrebbe avvenire entro il 2025. Il Financial Stability Board ha infine definito una serie di raccomandazioni per la regolazione delle stablecoin globali, toccherà adesso ai diversi paesi legiferare in materia.

Nel vuoto della regolazione il mondo dei cripto assets si è fatto male da solo. C’è chi sostiene che questo faccia parte di un cinico disegno delle autorità di vigilanza che, nell’incapacità di agire in modo efficace, hanno ben pensato di farlo scoppiare da solo, come successe nel diciassettesimo secolo nel caso della bolla dei bulbi di tulipano.

Il problema è serio, gli strumenti di tutela sono inadeguati e lo saranno ancora nel futuro prossimo, per il momento possiamo fare appello soltanto agli investitori, che imparino ad orientarsi nel mondo delle criptovalute comprendendo bene i rischi. A questo proposito, il consiglio è di stare attenti quando si vedono proposte fuori mercato: il 20% in un contesto in cui i titoli di stato italiani rendono l’1% non può essere privo di rischio, anzi è sicuramente molto molto rischioso e chi partecipa se ne assume i rischi. Vale il vecchio adagio che in finanza non c’è un pasto gratis: non si può mangiare senza rischiare.

EIOPA report on consumers trends
a cura di Silvia dell’Acqua

Feb 19 2023
EIOPA report on consumers trendsa cura di Silvia dell’Acqua

Fulfilling the duties required by article 9 of its founding regulation, last 18 January 2023 EIOPA published its annual (2022) Consumer Trends Report. The document aims at identifying the risks arising from trends in the insurance / pension market, that may require supervisory actions from the NCAs and EIOPA itself. This kind of monitoring is nowadays even more important, given the hope placed on the financial sector to improve the consumers’ financial health, currently damaged by disruptive events such as the pandemic, the Russian-Ukraine war, the increasing cost of energy and frequency in natural catastrophes. The report summarizes the results collected in a survey (“Eurobarometer”) carried out by EIOPA during 2022 on a representative sample of European consumers. The major outcomes are quoted in the following.

As a start, it’s worth recalling the meaning of “financial health”. According to the definition reported in the “Principles of Responsible Banking” developed by the United Nations Environment Programme (UNEP) and to the one given by the United Nations Secretary-General’s Special Advocate (UNSGSA), being “financially health” means being capable of smoothly meeting short terms needs, of absorbing financial shocks, of reaching future goals and feeling secure and in control of finances. When it comes to insurance and pensions, this imply having access to products that provide a sufficient coverage for financial and non-financial shocks (e.g. job loss or accidents), gain adequate returns and a secure income for retirement. The picture, sourced from the EIOPA Flash Consumers’ Eurobarometer 2022, provides the scattered European sentiment on how many people feel comfortable about their financial ability to live throughout retirement.

In addition to that, a considerable number of consumers consider themselves not to be able to face shocks either because they do not own an insurance product, or because those have limited or unclear coverages. To quote some figures:

  • [job loss] only 6% of consumers own a private insurance with no specific limits; 41% rely on government support and 10% are not sure about the coverage;
  • [accident] only 16% of consumers own a private health insurance with full coverage and an additional 10% are covered with high deductible, 17% are covered for just certain medical procedures and 11% are nor sure about the coverage.

Both high interest rates and high inflation have impacted the insurance business: the root of lapse rates increase can be found in the willing of seeking for more profitable instruments or in the immediate need of money to face the increased cost of living. The inflation has also damaged vulnerable groups in the sense that they are no longer able to keep up with the payment of regular premiums or contributions to voluntary pension schemes or cannot afford the needed insurance coverages. Furthermore, the inflation lowers the value of insurance coverages, especially when it comes to pension schemes (benefits do not really increase in a proportionate way) and home insurances (higher costs of construction materials in case of damage compared to a fixed insurance capital). Lastly, a gender gap emerged as a key trend, with female having lower access to insurance and pensions products: 56% of women (vs 46% men) are not confident to have enough money after the retirement.

A positive note comes from the financial innovation, that appears to facilitate the delivery of products and services, lower the distribution costs, improve the pricing practices and fasten the claims settlements. The increased trend observed in the usage of data-driven business models raises though some challenges, like the unfair discrimination of certain categories, charged with higher premiums (10% of the people interviewed said they have terminated their insurance contracts because of an unjustified increase in the premium) or data privacy concerns and cyber risk. Digitalisation and technology are also helping the pension system, with a witnessed increased engagement of members with their pensions and greater interest shown by younger generations, which ensures they will save more for retirement. The other side of the coin poses a risk in the potential exclusion of less tech members. Another positive note comes from the increased number of financial education programs that have been put in place in several Member States and that many NCAs and providers continue to invest in with the aim of improving consumers’ financial literacy and, in turn, their financial health.

Together with the disruptive events already recalled at the top of the article, in recent years, the transition towards a more sustainable economy has been under the light and the consumers’ appetite for sustainability-related investments has grown. To meet the increased demand, the insurance companies have adapted their products by promoting environmental or social characteristics or by offering sustainable investments. But as often happens, together with the good it comes the bad: misleading and unsubstantiated claims have led to evidence of greenwashing, that are being tackled by the supervisor activity since August 2020 thanks to the new sustainability-related requirements under the Insurance Distribution Directive (IDD34).

As said, a hope is placed on the financial sector to improve the consumers’ financial health: indeed, when designed to offer value and sold to meet the consumers’ needs, insurance products can provide important benefits. On this note, it’s worth recalling that in 2021 the total life insurance GWP increased by 14% across the EEA, albeit mostly driven by index and unit-link products (+35%), that shift the financial risk from the industry to the policyholders. To ensure a consumer-centric product design, the POG (Product Oversight and Governance) requirements were put in place back in 2018, with considerable improvements observed by the NCAs; however, concerns around the value for money and mis-selling of unit-linked products persist in terms of costs, complexity, target market, poor advice and conflict of interests. To address this, last 31st October 2022, EIOPA published a methodology to assess the value for money of unit linked and hybrid (multi-class) products, followed by many NCAs initiatives.

Lastly, it is important to comment on the insurance protection gap, observed across various lines of business and describable as the total uninsured losses. It is indeed usually expressed as the ratio between the uninsured losses and total losses, to provide an idea of the share of coverage. To quote some figures:

  • [natural catastrophe] on average, half of consumers are not covered (with important differences across the Member States, partially explained by the compulsoriness of the insurance in some of them) and 22% of them are unsure about the coverage in their policies;
  • [loss of income and urgent medical expenses] most of consumers (41%, 37%) rely on the state, as highlighted by the pandemic, during which the EU governments had to take unprecedented measures to cover the loss of income for workers and expenses for people hospitalisations.

The reason behind the formation and widening of the insurance protection gap is twofold: on the demand side, it stems from the non-affordability caused by the general increase in prices, together with the consumers’ awareness (unclear conditions, complex documentation, numerous exclusions); on the supply side, the insurers consider some risks too difficult to be insured and with low commercial appetite.

References:

[1] EIOPA, Consumers trends report 2022, 18 January 2023

[2] Silvia D.A., EIOPA and UL value for money, 20 November 2022

ECB publishes the Economic Bulletin Issue 1, 2023

Feb 19 2023

The Governing Council will stay the course in raising interest rates significantly at a steady pace and in keeping them at levels that are sufficiently restrictive to ensure a timely return of inflation to its 2% medium-term target. Accordingly, at its meeting on 2 February 2023, the Governing Council decided to raise the three key ECB interest rates by 50 basis points…

https://www.ecb.europa.eu//pub/economic-bulletin/html/eb202301.en.html