Most central banks are exploring central bank digital currencies (CBDCs), and their work continues apace amid the Covid-19 pandemic…
Feb
25
2021
Most central banks are exploring central bank digital currencies (CBDCs), and their work continues apace amid the Covid-19 pandemic…

L’iniziativa di Finriskalert.it “Il termometro dei mercati finanziari” vuole presentare un indicatore settimanale sul grado di turbolenza/tensione dei mercati finanziari, con particolare attenzione all’Italia.
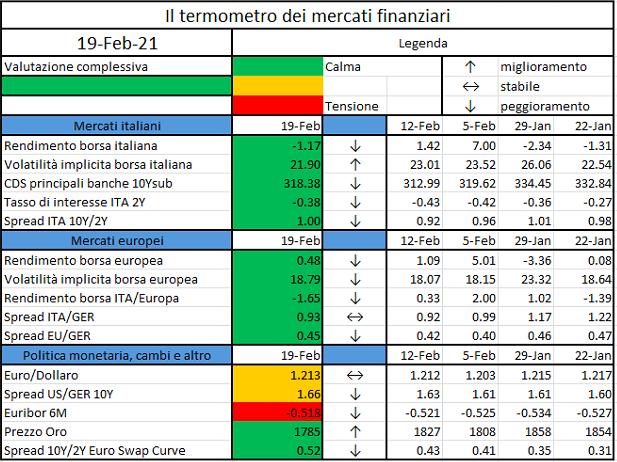
Significato degli indicatori
I colori sono assegnati in un’ottica VaR: se il valore riportato è superiore (inferiore) al quantile al 15%, il colore utilizzato è l’arancione. Se il valore riportato è superiore (inferiore) al quantile al 5% il colore utilizzato è il rosso. La banda (verso l’alto o verso il basso) viene selezionata, a seconda dell’indicatore, nella direzione dell’instabilità del mercato. I quantili vengono ricostruiti prendendo la serie storica di un anno di osservazioni: ad esempio, un valore in una casella rossa significa che appartiene al 5% dei valori meno positivi riscontrati nell’ultimo anno. Per le prime tre voci della sezione “Politica Monetaria”, le bande per definire il colore sono simmetriche (valori in positivo e in negativo). I dati riportati provengono dal database Thomson Reuters. Infine, la tendenza mostra la dinamica in atto e viene rappresentata dalle frecce: ↑,↓, ↔ indicano rispettivamente miglioramento, peggioramento, stabilità rispetto alla rilevazione precedente.
Disclaimer: Le informazioni contenute in questa pagina sono esclusivamente a scopo informativo e per uso personale. Le informazioni possono essere modificate da finriskalert.it in qualsiasi momento e senza preavviso. Finriskalert.it non può fornire alcuna garanzia in merito all’affidabilità, completezza, esattezza ed attualità dei dati riportati e, pertanto, non assume alcuna responsabilità per qualsiasi danno legato all’uso, proprio o improprio delle informazioni contenute in questa pagina. I contenuti presenti in questa pagina non devono in alcun modo essere intesi come consigli finanziari, economici, giuridici, fiscali o di altra natura e nessuna decisione d’investimento o qualsiasi altra decisione deve essere presa unicamente sulla base di questi dati.

Last 26th January EIOPA published a methodological paper on the liquidity stress testing for insurances, describing the principles to follow for a good appraisal of the resilience of insurances to liquidity shocks and providing a conceptual approach to measure the liquidity position under adverse scenarios. Indeed, despite the increased interest the NSAs (National Supervisor Authorities) have given to the liquidity risk, a common approach is still missing.
With this paper, EIOPA perseveres with its effort of improving the stress-testing framework, started back in July 2019 and materialized in June 2020, with a consultation paper covering three topics:
Let us discuss the main contents of the 26th January paper, named “Methodological principles of Insurance Stress-testing – liquidity component”.
Objective and scope
The stress testing should have both a micro and macro view, by assessing individual undertakings and by keeping under control the resilience of the entire industry, to avoid a potential spill over to the rest of the economy. The stress test shall be run where the liquidity risk is actually managed, being this the parent company or the local entity.
Definition of Liquidity risk
The liquidity risk describe a situation where an insurance company does not have enough money to pay out the claims. Currently, under the SII framework, the liquidity position is not subject to any quantitative requirement, although even solvent companies can face this risk, being it dependent on the characteristics of assets and liabilities rather than on their size. The liquidity risk for insurance companies has been so far consider of secondary importance, because of the inverted production cycle of the business: the inflow of premiums precedes the outflows of claims, providing a stable source of funding. Nevertheless, specific events can cause unexpected cash outflows that need to be covered.
The banking system considers the liquidity of assets through a haircut on their value: the higher the haircut, the lower the possibility to sell it during a crisis with no or little loss; the time horizon is a key element in determining the haircuts. Cash is considered to be the most liquid asset, with 0% haircut, while, at the opposite side, stand the investment on real estate, even when they cover a short time period.
The liquidity of liabilities is described by the uncertainty around the timing of the payments: the more predictable the cash outflows, the more illiquid the liabilities. In the banking system, this is driven by the volatility of the withdrawals from the deposits; while in the insurance sector, it depends on many factors, including products features, surrender penalties and dynamic policyholder behaviours.
Sources of liquidity risk
On the Asset side we can list
On the Liability side we can list
Measure of liquidity risk
Two perspectives are considered, complementing each other with their pros and cons: the stock-based approach is simpler (for both companies to calculate and regulators to validate), building on existing SII reporting, while the CFs approach provides a more granular view.
Stock-based approach
The Liquidity Stock indicator is defined as a ratio between sources (liquids assets) and needs (liquid liabilities), where original assets and liabilities are changed to consider their liquidity
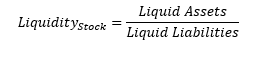
The Liquid Assets are obtained through the application of the haircuts mentioned above, while Liquid Liabilities can be obtained following two alternative methods:
Cashflow-based approach
Projected liquidity sources (premiums, sales of assets, investment coupons and dividends, reinsurance inflows) and needs (claims, purchase of assets, margin calls, operational expenses, reinsurance outflows) are compared on a given time horizon to determine to what extent outflows are covered by inflows. The CFs should come from real world projections. A CFs indicator can be defined either as a net flow value

or as a ratio between the two.
Stock and flow perspectives can be combined into an integrated indicator of “Sustainability of the flow position”:

In case of negative net flows, the indicator assesses whether Liquid assets are sufficient to cover the outflows.
In case of negative net flows, the indicator assesses whether Liquid assets are sufficient to cover the outflows.
ESMA has published a working paper on MiFID II research unbundling. During the webinar you will see a presentation of the working paper and its findings, followed by a Q&A session…
https://www.esma.europa.eu/press-news/hearings/esma-webinar-wp-mifid-ii-research-unbundling
Severe economic slump with long-lasting effects…
https://www.ecb.europa.eu//press/key/date/2021/html/ecb.sp210218~d8857e8daf.en.pdf
Today I will discuss some recent developments in the foreign exchange market, and provide some views on the role of the Reserve Bank’s various policy measures…
Local firm Bitcoin Suisse has partnered with the canton of Zug, converting cryptocurrency tax payments into Swiss francs…
L’iniziativa di Finriskalert.it “Il termometro dei mercati finanziari” vuole presentare un indicatore settimanale sul grado di turbolenza/tensione dei mercati finanziari, con particolare attenzione all’Italia.

Significato degli indicatori
I colori sono assegnati in un’ottica VaR: se il valore riportato è superiore (inferiore) al quantile al 15%, il colore utilizzato è l’arancione. Se il valore riportato è superiore (inferiore) al quantile al 5% il colore utilizzato è il rosso. La banda (verso l’alto o verso il basso) viene selezionata, a seconda dell’indicatore, nella direzione dell’instabilità del mercato. I quantili vengono ricostruiti prendendo la serie storica di un anno di osservazioni: ad esempio, un valore in una casella rossa significa che appartiene al 5% dei valori meno positivi riscontrati nell’ultimo anno. Per le prime tre voci della sezione “Politica Monetaria”, le bande per definire il colore sono simmetriche (valori in positivo e in negativo). I dati riportati provengono dal database Thomson Reuters. Infine, la tendenza mostra la dinamica in atto e viene rappresentata dalle frecce: ↑,↓, ↔ indicano rispettivamente miglioramento, peggioramento, stabilità rispetto alla rilevazione precedente.
Disclaimer: Le informazioni contenute in questa pagina sono esclusivamente a scopo informativo e per uso personale. Le informazioni possono essere modificate da finriskalert.it in qualsiasi momento e senza preavviso. Finriskalert.it non può fornire alcuna garanzia in merito all’affidabilità, completezza, esattezza ed attualità dei dati riportati e, pertanto, non assume alcuna responsabilità per qualsiasi danno legato all’uso, proprio o improprio delle informazioni contenute in questa pagina. I contenuti presenti in questa pagina non devono in alcun modo essere intesi come consigli finanziari, economici, giuridici, fiscali o di altra natura e nessuna decisione d’investimento o qualsiasi altra decisione deve essere presa unicamente sulla base di questi dati.
Discussing the role of banks in the time of COVID-19 is indeed vital. Banking is as important to the economy as the heart is to the human body…

La diffusione su scala globale del COVID-19 ha rappresentato la più grande emergenza sanitaria dal dopoguerra, con una ricaduta di vasta portata sia sull’economia reale (l’Eurozona chiude il 2020 con un -7,8%, -8,3% l’Italia[1]) che sui mercati finanziari (FTSE -8,9% nel periodo marzo-giugno 2020[2]). I bisogni e le abitudini dei consumatori hanno subito profondi cambiamenti – la digitalizzazione di attività lavorative e formative, la crescita dell’e-commerce, la propensione crescente all’acquisto di prodotti per la salute, le limitazione dei trasferimenti, la maggiore sensibilità verso sostenibilità ambientale e sociale, la remotizzazione dei rapporti sociali e la riscoperta dei valori familiari – destinati a perdurare nel tempo.
Tutto questo ha avuto un impatto sul settore del Wealth Management (WM), sebbene la pandemia non abbia mutato trend e sfide già chiari a partire dal 2015:
Per alcuni player ne ha rafforzato la consapevolezza e l’urgenza di avviare un percorso di trasformazione.
In questo articolo ci dedicheremo ad analizzare, in particolare, gli effetti della digitalizzazione sui modelli di servizio e operativi.
Rispetto al passato la propensione al digitale dei Clienti WM è cresciuta e l’esperienza, piuttosto che i prodotti, è più che mai un fattore differenziante. Questa attenzione non è più un tema limitato agli investitori retail o affluent, ma un fenomeno mainstream che riguarda tutti i segmenti, inclusi i Private e High-Net-Worth.
Uno studio condotto da Deloitte negli Stati Uniti[3] rileva che anche i “grandi ricchi” si aspettano tool digitali da utilizzare in autonomia per valutare e simulare prima di incontrare il proprio consulente, o desidererebbero strumenti di simulazione di portafoglio (es. Robo Advisor) per monitorare il proprio patrimonio e tenere sotto controllo l’operato del proprio consulente.
Tre sono gli ingredienti principali per un’esperienza TOP:
Il corretto mix di questi elementi determina il perfetto equilibrio tra human e machine. Un’esperienza TOP considera il Cliente come un essere soggetto a sentimenti di ansia ogni volta che il mercato è volatile, indipendentemente dalle rassicurazioni di una telefonata da parte del Consulente (human) o di una comunicazione digitale generata da un algoritmo next-best-action (machine): la cosa fondamentale è riconoscere e gestire l’esigenza del cliente in maniera puntuale e in tempo reale.
Anche i Consulenti Finanziari (CF), un tempo restii all’utilizzo di strumenti digitali, hanno sviluppato la consapevolezza che preservare la relazione, continuando a ricoprire un ruolo centrale per il Cliente, non esclude l’utilizzo di strumenti evoluti in grado di generare efficienza (digitalizzazione dei processi di onboarding e dispositivi), profondità e ampiezza di analisi (motori di robo-advisory, big data & analytics) e tempestività e trasparenza nella comunicazione (comunicazioni digitali, reporting periodico).
Le aspettative dei CF non sono molto diverse da quelle dei Clienti:
Un’esperienza TOP può essere realizzata attraverso funzionalità, applicazioni e strumenti in grado di aumentare la produttività dei CF, stimolare i migliori talenti nonché attrarne di nuovi dal mercato.
Il fattore abilitante per la realizzazione di un’esperienza di questo tipo è la costruzione di piattaforme scalabili e abilitate digitalmente disegnate attorno all’utente, che siano in grado di traghettare l’organizzazione da un contesto di “doing digital” a un contesto di “be digital”:
Resta ancora molto lavoro prima che piattaforme WM completamente scalabili e abilitate digitalmente diventino una realtà:
Possiamo però anticipare che un recente studio di Deloitte ha evidenziato 5 tendenze strutturali che influenzeranno il processo di trasformazione del settore WM:
Il rischio per le società è quello di allentare gli sforzi di trasformazione a fronte di un mercato più stabile rispetto a 1 anno fa o presumere di aver fatto abbastanza e perdere l’opportunità di trasformare la propria infrastruttura e il proprio modello di business.
Autori:
Alessandra Ceriani, DCM FSI Consulting Leader
Alessandro Mastrantuono, Business Operations – Responsabile Wealth & Investment Management
Luigi Capitanio, Monitor Deloitte – Responsabile Strategy Banking
Giuseppina Lai, Business Operations – Director Wealth & Investment Management
[1] Quadro previsionale Commissione Europea, Novembre 2020
[2] Sito pubblico Stock Exchanges official
[3] The Digital Wealth Manager of the Future, Deloitte Consulting LLP, 2017
