ECB released the biannual Financial Stability Review

Mag 28 2018

The European Central Bank released the biannual Financial Stability Review on the financial markets conditions in the EU Area.

Systemic risk for the euro area has remained low over the past six months, the latest biannual Financial Stability Review of the European Central Bank finds. This was helped by better growth prospects, both outside and in the euro area.

However, vulnerabilities are building up in global financial markets. A surge in volatility in US stock markets in early February highlighted the current fragile market sentiment. Narrow risk premia and signs of increased risk-taking in most global financial markets require close attention. At this stage, no broad-based asset price misalignments can be observed across euro area financial and tangible assets. Yet, some pockets of stretched valuations are appearing, particularly for lower-rated bonds and in certain real estate markets.

The profitability of euro area banks improved on the back of a better cyclical situation. The level of profitability is, however, still weak, reflecting persisting structural challenges. Larger capital buffers have made banks more resilient and banks have not stepped up their risk-taking to boost their revenue.

The euro area sovereign sector has also become more resilient thanks to the improved macroeconomic outlook, helping keep financing costs low in some countries. Headline fiscal balances and indebtedness of euro area countries are expected to improve over the coming years, supported by the advantageous cyclical conditions. However, a deteriorating growth environment or a loosening of the fiscal stance in high-debt countries could impact the fiscal outlook and, by extension, market sentiment towards some euro area sovereign issuers.

The Review also highlights risks building up in the investment fund sector. Aiming to boost returns, funds have extended the maturity and increased the credit risk of their portfolios. At the same time, they have drawn down their liquidity buffers. Together, these developments make investment funds more prone to amplifying any repricing in global financial markets.

The Review singles out four main risks to financial stability in the euro area over the next two years. The first risk relates to spillovers from a disruptive repricing of risk premia in global financial markets. The second risk relates to a potential hampering of the ability of banks to intermediate amid weak financial performance compounded by structural challenges. The third risk relates to public and private debt sustainability concerns amid historically high debt levels. Finally, the fourth risk relates to liquidity risks that could emerge in the non-bank financial sector, with contagion to the broader system. All four of these risks are intertwined and any one of them could trigger the others.

The Review also contains three special features. The first special feature presents a new composite financial stability risk index (FSRI) aimed at predicting large adverse shocks to the real economy in the near term. The second introduces a composite cyclical systemic risk indicator (CSRI) designed to signal risks of a financial crisis over the medium term. The third analyses the distribution of interest rate risk in the euro area economy using balance sheet data and information on derivative positions from significant credit institutions.

Financial Stability Review May 2018 (HTML)

Il termometro dei mercati finanziari (25 maggio 2018)
di Emilio Barucci e Daniele Marazzina

Mag 28 2018
Il termometro dei mercati finanziari (25 maggio 2018)  di Emilio Barucci e Daniele Marazzina

Presentiamo oggi una nuova iniziativa di Finriskalert.it: il termometro dei mercati finanziari. Questa rubrica vuole presentare un indicatore settimanale sul grado di turbolenza/tensione dei mercati finanziari con particolare attenzione all’Italia.

In una pagina presenteremo alcune informazioni di mercato avvalendoci dei colori del semaforo per rappresentare sinteticamente la situazione.

Cominciamo dandovi una rappresentazione sintetica sull’andamento dei mercati finanziari.

Entriamo poi nei dettagli, analizzando

  • Mercati italiani
  • Mercati europei
  • Politica monetaria e tassi di cambio.

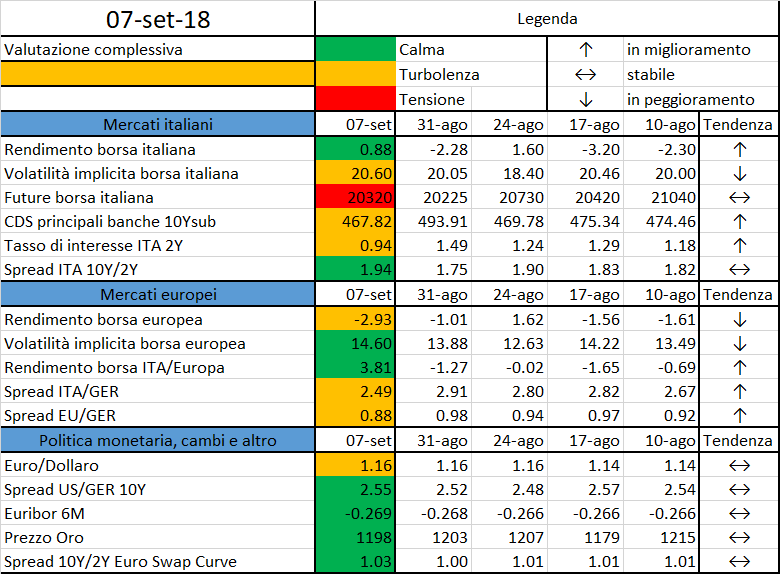
Per quanto riguarda i mercati italiani, ecco le informazioni che presentiamo

dove:

  • Rendimento borsa italiana: rendimento settimanale dell’indice della borsa italiana FTSEMIB;
  • Volatilità implicita borsa italiana: volatilità implicita calcolata considerando le opzioni at-the-money sul FTSEMIB a 3 mesi;
  • Future borsa italiana: valore del future sul FTSEMIB;
  • CDS principali banche 10Ysub: CDS medio delle obbligazioni subordinate a 10 anni delle principali banche italiane (Unicredit, Intesa San Paolo, MPS, Banco BPM);
  • Tasso di interesse ITA 2Y: tasso di interesse costruito sulla curva dei BTP con scadenza a due anni;
  • Spread ITA 10Y/2Y : differenza del tasso di interesse dei BTP a 10 anni e a 2 anni.

I colori sono assegnati in un’ottica VaR: se il valore riportato è superiore (inferiore) al quantile al 15%, il colore utilizzato è l’arancione. Se il valore riportato è superiore (inferiore) al quantile al 5% il colore utilizzato è il rosso. La banda (verso l’alto o verso il basso) viene selezionata, a seconda dell’indicatore, nella direzione dell’instabilità del mercato. I quantili vengono ricostruiti prendendo la serie storica di un anno di osservazioni: ad esempio, un valore in una casella rossa significa che appartiene al 5% dei valori meno positivi riscontrati nell’ultimo anno.

La tendenza mostra la dinamica in atto e viene rappresentata dalle frecce: ↑,↓, ↔  indicano rispettivamente miglioramento, peggioramento, stabilità.

Per quanto riguarda i mercati esteri, presentiamo le seguenti informazioni:

dove:

  • Rendimento borsa europea: rendimento settimanale dell’indice delle borse europee Eurostoxx;
  • Volatilità implicita borsa europea: volatilità implicita calcolata sulle opzioni at-the-money sull’indice Eurostoxx a scadenza 3 mesi;
  • Rendimento borsa ITA/Europa: differenza tra il rendimento settimanale della borsa italiana e quello delle borse europee, calcolato sugli indici FTSEMIB e Eurostoxx;
  • Spread ITA/GER: differenza tra i tassi di interesse italiani e tedeschi a 10 anni;
  • Spread EU/GER: differenza media tra i tassi di interesse dei principali paesi europei (Francia, Belgio, Spagna, Italia, Olanda) e quelli tedeschi a 10 anni;
  • Spread GER 10Y/2Y: differenza del tasso di interesse tedesco a 10 anni e quello a 2 anni.

Infine, per la politica monetaria riportiamo:

dove:

  • Euro/dollaro: tasso di cambio euro/dollaro;
  • Spread US/GER 10Y: spread tra i tassi di interesse degli Stati Uniti e quelli tedeschi con scadenza 10 anni;
  • Euribor 6M: tasso euribor a 6 mesi.

In questi ultimi tre casi, le bande per definire il colore sono simmetriche (valori in positivo e in negativo). I dati riportati provengono dal database Thomson Reuters.

Speriamo di fornirvi così un utile strumento settimanale per fotografare l’andamento del mercato.

Disclaimer: Le informazioni contenute in questa pagina sono esclusivamente a scopo informativo e per uso personale. Le informazioni possono essere modificate da finriskalert.it in qualsiasi momento e senza preavviso. Finriskalert.it non può fornire alcuna garanzia in merito all’affidabilità, completezza, esattezza ed attualità dei dati riportati e, pertanto, non assume alcuna responsabilità per qualsiasi danno legato all’uso, proprio o improprio delle informazioni contenute in questa pagina. I contenuti presenti in questa pagina non devono in alcun modo essere intesi come consigli finanziari, economici, giuridici, fiscali o di altra natura e nessuna decisione d’investimento o qualsiasi altra decisione deve essere presa unicamente sulla base di questi dati.

Technology is no substitute for trust

Mag 28 2018

The General Manager of the Bank for International Settlement (BIS) Agustín Carstens, released an interview to the German Financial Newspaper Boersen Zeitung. The main object of the interview was trust, namely, what should be the best way to preserve trust in financial transactions. We report here an extract of the newspaper report.

With new cryptocurrencies proliferating, he underlines the importance of educating the public about good money as it is to build defences against fake news, online identity theft and Twitter bots. Conjuring up new cryptocurrencies is the latest chapter in a long story of attempts to invent new money, as fortune seekers have tried to make a quick buck.

However, they should not be conflated with the sovereign currencies and established payment systems that have stood the test of time. What makes currencies credible is trust in the issuing institution, and successful central banks have a proven record of earning this public trust.  Above all, the technology behind cryptocurrencies makes them inefficient and certainly less effective than the digital payment systems already in place.

First, the highly volatile valuations of cryptocurrencies conflict with the stable monetary values that must underpin any system of transactions which sustains economic activity.

Second, the many cases of fraud and theft show that cryptocurrencies are prone to a trust deficit. Given the size and unwieldiness of the distributed ledgers that act as a register of crypto-holdings, consumers and retail investors in fact access their “money” via third parties (crypto-wallet providers or crypto-exchanges.) Ironically, investors who opted for cryptocurrencies because they distrusted banks have thus wound up dealing with entirely unregulated intermediaries that have in many cases turned out to be fraudulent or have themselves fallen victim to hackers.

Third, there are fundamental conceptual problems with cryptocurrencies. Making each and every user download and verify the history of each and every transaction ever made is just not an efficient way to conduct transactions. This cumbersome operational setup means there are hard limits on how many, and how quickly, transactions are processed. Cryptocurrencies therefore cannot compete with mainstream payment systems, especially during peak times. This leads to congestion, transaction fees soar, and very long delays result.

In the end, one has to ask if cryptocurrencies are an improvement compared with current means of payment. The technology behind cryptocurrencies could be used in other interesting ways, however. Central banks have long championed the use of new payment technologies – as long as they prove socially useful – in the interests of increased efficiency.


Agustín Carstens Full Speech – BIS (HTML)

Uno sguardo dentro Bitcoin
di Giancarlo Giuffra Moncayo

Mag 28 2018
Uno sguardo dentro Bitcoin  di Giancarlo Giuffra Moncayo

In questo articolo guarderemo dentro i meccanismi che permettono a Bitcoin di funzionare come mezzo per scambiare del valore. Inizieremo introducendo Bitcoin come un protocollo che risolve il problema del double spending. Parleremo poi di come Bitcoin offre una soluzione decentralizzata a tale problema grazie all’algoritmo di Proof of Work. Infine vedremo i dettagli di questo algoritmo di consenso.

Che cos’è Bitcoin?

Bitcoin1 è un protocollo, cioè delle regole per costruire, interpretare e scambiarsi dei messaggi. Nel caso di Bitcoin questi messaggi rappresentano delle transazioni. Il protocollo2 ha la caratteristica di essere peer-to-peer, cioè tutti i nodi che decidono di partecipare al protocollo hanno gli stessi privilegi, tutti i nodi sono uguali. D’altra parte, Bitcoin è anche l’oggetto di questi messaggi, cioè si chiama Bitcoin la crittovaluta o asset digitale che viene scambiato nelle transazioni. Anche se risulta facile capire dal contesto a quale Bitcoin uno si riferisce penso che sia utile fare attenzione alla differenza.

Essendo Bitcoin un protocollo, ovvero una specifica, ha diverse implementazioni. Queste implementazioni si chiamano bitcoin client3, e sono il software che i nodi che formano parte della rete di Bitcoin hanno in esecuzione nei loro dispositivi, e.g. PC, GPU, ASIC. Il primo bitcoin client fu pubblicato nel 2009 da Satoshi Nakamoto. Questo client open source si è evoluto nel tempo e attualmente viene identificato con il nome di Bitcoin Core4. Il client viene mantenuto da una communità di sviluppatori che viene denominata con lo stesso nome del client.

Il Problema: Double Spending

Bitcoin nasce come protocollo per dare una soluzione peer-to-peer al problema del double spending, dove l’enfasi è in peer-to-peer. Questo problema consiste nell’impedire che un nodo del sistema possa spendere più di una volta la stessa moneta elettronica. Attualmente, quando effettuiamo dei pagamenti elettronici, il compito di controllare che non succedano casi di double spending viene delegato al circuito di pagamento utilizzato, che in modo centralizzato svolge tale compito.Tentativi di sistemi di pagamento elettronico5 precedenti a Bitcoin risolvevano sempre in modo centralizzato questo problema. In effetti, la decentralizzazione di Bitcoin è una delle sue caratteristiche più innovative e importanti.

La Soluzione: Proof of Work

Bitcoin risolve il problema del double spending utilizzando l’algoritmo di Proof of Work. L’obbiettivo di questo algoritmo è quello di ordinare temporalmente le transazioni. In questo modo se ci sono due transazioni che cercano di spendere gli stessi Bitcoin la rete considererà valida solo la transazione che in accordo con l’algoritmo di Proof of Work è avvenuta per prima. L’innovazione in Bitcoin è che il consenso per quanto riguarda l’ordine temporale delle transazioni viene raggiunto in modo decentralizzato, ciascun nodo arriva alle stesse conclusioni in modo autonomo. Di fatto ciascun nodo ricostruisce l’intera catena di blocchi nel proprio dispositivo.

Come funziona la Proof of Work?

Per entrare nei particolari di questo processo penso che sia necessario introdurre alcuni concetti: transazioni, blocchi e il ruolo dei Miner. Partiamo dalla validazione delle transazioni.

Validazione delle Transazioni

Bitcoin è un protocollo per costruire, interpretare e scambiarsi transazioni. Ad ogni istante quindi ci sono nodi che inviano ai loro vicini le transazioni che hanno costruito secondo il formato del protocollo. Quando una di queste transazioni arriva a un nodo, il bitcoin client processa la transazione e determina se questa è valida o meno, e.g. controlla se i Bitcoin di questa transazione sono stati già spesi e che chi sta spendendo tali Bitcoin abbia effettivamente il diritto di farlo6. Se la transazione è valida il nodo propaga la stessa ai suoi vicini, altrimenti la transazione viene rifiutata e semplicemente non viene propagata alla rete. In questo modo tutti i nodi vengono a conoscenza delle transazioni valide che gli altri nodi creano.

I Miner

A questo punto entra in scena il ruolo del Miner, che raggruppa delle transazioni valide in una struttura dati particolare7 e aggiunge alcuni altri dati. L’insieme di questi dati più la struttura che contiene le transazioni formano quello che viene chiamato un blocco, uno dei tanti che fanno parte della blockchain. Un dettaglio importante è che tra i dati che il Miner aggiunge al blocco c’è l’hash del blocco precedente. Questo è il meccanismo che permette di legare temporalmente i blocchi formando così una catena che rappresenta il consenso della rete riguardo l’ordine delle transazioni (si veda Figura 1). La creazione di questi blocchi però è soggetta a certe regole. Abbiamo in effetti tralasciato un dettaglio importante, la validazione del blocco.

Figure 1: Ogni blocco contiene l’hash del blocco precedente. Questo meccanismo permette di legare temporalmente i blocchi.

Validazione dei Blocchi

Man mano che i blocchi vengono creati questi vengono propagati alla rete e come avete intuito vengono sottoposti ad una validazione da parte di ciascun nodo che li riceve, propagando solo quelli validi. In effetti una parte di tale validazione8 è legata all’algoritmo di Proof of Work e riguarda l’hash del blocco. Un blocco è considerato valido solo se il suo hash è minore9 di un certo valore chiamato target. Per soddisfare questa condizione il Miner ha a disposizione, tra i dati che aggiunge al blocco, una componente che può scegliere a suo piacimento. Questa componente viene chiamata nonce. La proprietà di non invertibilità della funzione di hash SHA-256 costringe il Miner a semplicemente provare diversi nonce per trovare un hash che soddisfi la condizione di validità. Non esiste effettivamente una strategia che garantisca una maggiore probabilità di trovare un hash valido10. L’unica altra variabile che il Miner può controllare oltre al nonce è la potenza di calcolo che decide di dedicare e che aumenta in modo proporzionale la sua probabilità di trovare un blocco valido. In questo modo il Miner inviando un blocco valido alla rete sta effettivamente dando prova di aver fatto del lavoro per mantenere sicura la rete, cioè è a tutti gli effetti una Proof of Work.

Calcolo del target

Rimane in sospeso il dettaglio di come viene determinato il valore di target che definisce la condizione di validità dell’hash di un blocco. Il protocollo Bitcoin utilizza questo target per mantenere attorno ai 10 minuti la frequenza di creazione dei blocchi. In effetti all’aumentare della capacità computazionale che i Miner dedicano alla rete, aumenta la probabilità che qualcuno trovi un hash valido e di conseguenza anche la frequenza di creazione dei blocchi. Vale ovviamente anche il viceversa. La scelta dei 10 minuti è stata fatta per motivi di stabilità e latenza11. Per adeguarsi quindi alla capacità computazionale della rete, il target viene aggiornato ogni 2016 blocchi. Ogni nodo della rete calcola l’intervallo temporale che è stato necessario per la creazione degli ultimi 2016 blocchi e lo compara con un intervallo di due settimane, cioè il tempo che sarebbe trascorso se tutti i blocchi fossero stati creati esattamente ogni 10 minuti. Dopodiché calcola la differenza percentuale tra queste due quantità e aggiorna l’attuale valore di target in base a tale percentuale12 (Si veda Figura 2).

Figure 2: Ogni nodo calcola il tempo che la rete ha impiegato in creare gli ultimi 2016 blocchi e lo compara con un intervallo di 20160 minuti. Il target viene aggiornato secondo la differenza percentuale tra queste due quantità.

Alcuni Dettagli Importanti

Abbiamo visto finora come i nodi Miner dedicano capacità computazionale alla rete per mantenere ordinate temporalmente le transazioni in una catena di blocchi e come tutti gli altri nodi, inclusi quindi anche eventuali nodi Miner, validano questo lavoro computazionale espresso in ciascun blocco. Abbiamo anche visto come la rete Bitcoin si autoregola per mantenere la capacità di processare transazioni stabile attorno ai 10 minuti per blocco. Vorrei adesso parlare di due dettagli importanti: chi sono effettivamente questi nodi Miner e come si risolve l’eventualità di ricevere due blocchi diversi ma validi che puntano allo stesso blocco precedente.

Chi sono effettivamente questi Miner?

La risposta si trova nella natura peer-to-peer di Bitcoin. Qualunque nodo può fare il Miner se ha delle risorse computazionali da dedicare alla rete. Ovviamente le risorse computazionali hanno un costo e questo è stato considerato nel disegno del protocollo. In effetti, il Miner ha diritto ad includere nel blocco una transazione addizionale13. Il beneficiario di questa transazione è scelto dal Miner e molto probabilmente sarà lui stesso. Invece l’ammontare della transazione è definito dal protocollo. Quindi il ruolo del Miner non è solo quello di mantenere sicura la rete ma anche quello di generare o minare Bitcoin. In questo modo il Miner ha un incentivo per dedicare risorse alla sicurezza della rete. Oltre a questa transazione, il Miner ha anche diritto a prendersi le commissioni14 espresse in ciascuna transazione inclusa nel blocco che ha generato. Come abbiamo detto la quantità di nuovi Bitcoin che il Miner può mettere in circolazione dipende dal protocollo. Inizialmente questa quantità era 50 Bitcoin ma viene dimezzata ogni 210 000 blocchi, che corrispondono circa a 4 anni. Questo fa di Bitcoin una moneta non inflazionaria, in effetti il meccanismo di dimezzamento garantisce che non potranno mai esistere più di 21 millioni di Bitcoin.

Come si risolvono i Fork?

Risulta possibile che due Miner in contemporanea trovino blocchi validi. Questi due blocchi saranno propagati nella rete e di conseguenza i nodi avranno due catene valide che differiscono unicamente nell’ultimo blocco, cioè ci saranno due fork15. Questa ambiguità temporanea viene risolta quando il blocco successivo viene trovato. Questo nuovo blocco sarà in effetti collegato solo a uno dei due blocchi e il bitcoin client sceglierà, come da protocollo, la catena che abbia la difficoltà complessiva più alta consentendo alla rete di raggiungere così di nuovo il consenso. Il valore di difficoltà viene calcolato in base al target. Quindi normalmente la catena con più difficoltà complessiva sarà quella più lunga. Solo in concomitanza con l’aggiornamento del valore di target è probabile che questo non sia il caso (Si veda Figura 3).

Figure 3: Si osserva come in concomitanza di un aggiornamento di target è possibile che la catena con la difficoltà complessiva più alta non sia quella più lunga. Nell’esempio la catena B, più corta di un blocco rispetto alla catena A, ha una difficoltà complessiva maggiore.

Conclusione

Questo sguardo dentro Bitcoin ci è servito per capire come si incastrano i diversi pezzi del protocollo e quali sono le diverse fasi della vita di una transazione (Si veda Figura 4). Abbiamo però parlato in modo generico del concetto di transazione e non abbiamo descritto come vengono effettivamente trasferiti i Bitcoin. Nell’articolo successivo analizzeremo la struttura di una transazione.

(a) Il nodo A crea una transazione.


(b) Il nodo A invia la transazione ai suoi vicini. Il nodo D l’ha ricevuta, validata e propagata.


(c) Il Miner C valida la transazione, la include in un blocco e genera una Proof of Work valida.


(d) Il Miner C invia il blocco ai suoi vicini. Il nodo B l’ha ricevuto, validato e propagato.


(e) Il nodo A riceve il blocco che contiene la sua transazione. Lo valida e così verifica la sua prima confirmation.

(f) Il nodo A aspetta fino a validare la sesta confirmation per considerare la transazione definitiva.

Figure 4: Nello schema si vede lo stato di una rete Bitcoin semplificata ad ogni fase della vita di una transazione: generazione, propagazione e validazione, inclusione in un blocco, propagazione e validazione del blocco, e infine la prima confirmation. Si ricorda che si consiglia di aspettare fino ad avere 6 confirmation per considerare la transazione definitiva.


Note

1Satoshi Nakamoto, il creatore di Bitcoin, pubblicò la prima specifica del protocollo in questo paper [1] del 2008.

2Per entrare nei dettagli dell’attuale protocollo si può partire da questa pagina [2] della bitcoin wiki.

3Si può trovare una lista dei maggiori bitcoin client qui [3].

4La pagina github di Bitcoin Core si può trovare qui [4].

5Trovate un resoconto dei predecessori di Bitcoin nella prefazione del libro Bitcoin and Cryptocurrency Technologies [5]

6Vedremo i dettagli di questa validazione in un successivo articolo, dopo aver studiato la struttura delle transazioni.

7La struttura per raggruppare le transazioni si chiama Merkle Tree [6], con un singolo hash può identificare un vasto gruppo di transazioni.

8Per avere una descrizione completa della validazione di un blocco si può vedere la sezione corrispondente nella seguente pagina [7].

9Siamo abituati a rappresentare un hash in base esadecimale, ma essendo un array di byte può facilmente rappresentarsi in base decimale ed ereditare così le operazioni di confronto che conosciamo.

10Si veda la sezione 3 del paper di hashcash [8].

11Si veda la relativa FAQ [9] della bitcoin wiki per approfondire il tema della scelta dei 10 minuti.

12Si può trovare uno storico della difficoltà(inversamente proporzionale al target) qui [10].

13Questa transazione viene chiamata coinbase [11].

14Le commissioni sono definite autonomamente dal nodo che ha generato la transazione. Vedremo come vengono specificate queste commissioni in un successivo articolo, dopo aver studiato la struttura di una transazione.

15Questo tipo di fork è temporaneo e previsto dal protocollo. Non è da confondersi con i concetti di Hard Fork e Soft Fork, che sono due metodologie diverse per aggiornare un’applicazione distribuita com’è il caso di un bitcoin client.


Bibliografia

[1] Satoshi Nakamoto. Bitcoin: A peer-to-peer electronic cash system. 2008.

[2] Bitcoin Wiki. Protocol documentation. https://en.bitcoin.it/wiki/Protocol_documentation.

[3] Bitcoin Wiki. Clients. https://en.bitcoin.it/wiki/Clients.

[4] Bitcoin Core. Github. https://github.com/bitcoin/bitcoin.

[5] Arvind Narayanan, Joseph Bonneau, Edward Felten, Andrew Miller, and Steven Goldfeder. Bitcoin and Cryptocurrency Technologies: A Comprehensive Introduction. Princeton University Press, 2016.

[6] Wikipedia. Merkle tree. https://en.wikipedia.org/wiki/Merkle_tree.

[7] Bitcoin Wiki. Protocol rules. https://en.bitcoin.it/wiki/Protocol_rules.

[8] Adam Back. Hashcash-a denial of service counter-measure. 2002.

[9] Bitcoin Wiki. Faq. https://en.bitcoin.it/wiki/Help:FAQ.

[10] BitcoinWisdom. Difficulty. https://bitcoinwisdom.com/bitcoin/difficulty.

[11] Bitcoin Wiki. Coinbase. https://en.bitcoin.it/wiki/Coinbase.

Polimi Fintech Journey – From Blockchain&Bitcoin to Distributed Ledger Technologies, Smart Contracts and Cryptocurrencies in Finance

Mag 16 2018
Polimi Fintech Journey – From Blockchain&Bitcoin to Distributed Ledger Technologies, Smart Contracts and Cryptocurrencies in Finance

Il 9-10 Maggio 2018 si è tenuta al Politecnico di Milano la conferenza

From Blockchain&Bitcoin to Distributed Ledger Technologies, Smart Contracts and Cryptocurrencies in Finance

Di seguito il programma e le slide delle presentazioni.

9 Maggio 2018

IT TUTORIAL

9.00 – 13.30 – Information Technology for DLTs

Daniele Marazzina – An introduction to DLTs

Francesco Bruschi e Vincenzo Rana – Developping Smart Contract

Stefano Leone – ICOs vs Kryptokitty

CONFERENZA

14.45  – 18.30  – Session 1. DLT and Smart Contracts

Andrea Bracciali – Decentralised governance?

Massimo Bartoletti – Models for Bitcoin smart contracts

Francesco Bruschi – Stretching our oracles farther: making smart contract aware of the world

Andrea Visconti – On the cryptography of DLT

Stefano Bistarelli – An End-to-end Voting-system Based on DLTs

10 Maggio 2018

9.30 – 13.00 – Session 2. The economics and the Finance of DLT/smart contracts

Davide Grossi – Incentive Structures behind Consensus in Distributed Ledgers

Ferdinando Ametrano – Central bank digital cash and private monies

Simon Trimborn – Investing with Cryptocurrencies – A liquidity constrained investment approach

Gianna Figà Talamanca – Attention-based dynamics for BitCoin price modeling and applications

Giancarlo Giudici – The ICO market

14.45  – 17.15  – Session 3. Applications of DLT and smart contracts in finance

Giovanni Sartor – On Legal contracts, Imperative abd Declarative Smart Contracts and Blockchain Systems

Claudio Impenna – DLT applications in the financial sector: the regulator’s perspective

Giorgio Gasparri – Distributed ledger technology and financial markets

Massimo Morini – Transforming Banks


MiFID II: a revolution of trading activity in the capital market landscape
a cura di Deloitte Italia

Mag 15 2018
MiFID II: a revolution of trading activity in the capital market landscapea cura di Deloitte Italia

Today’s European financial markets hardly look like the ones from 10 years ago. Financial Markets are definitely more complex: high speed of electronic trading, wide range and complexity of financial instruments, explosion in trading volumes, fragmentation of trading venues and proliferation of OTC trading activity.

The impact of the latest financial crisis has forced Regulators globally to take an action and a new set of regulations has been released. MiFID II is, no doubt, the regulation that first springs to mind talking about Capital Markets.

Entered into force on January this year, MiFID II has on one side reinforced the financial market infrastructure, among all: introduction of the OTFs to capture OTC trading activities, trading obligation on equity and standardized derivatives, new transparency regime, a new information package available, strengthening reporting activity to competent authorities. On the other side, and this is the most innovative part, MiFID II has answered the need to discipline technological developments in trading, particularly Algorithmic and High Frequency Trading (HFT).

The new market structure – Key innovations

MiFID II brings important changes in the market structure of European capital markets to basically increase transparency of the trading and to restrict over the counter trading.

A third category of trading venue the Organised Trading Facilities (OTFs) sit now alongside the Regulated Markets (RMs) and Multilateral Trading Facilities (MTFs). OTFs have been introduced to push OTC trading platforms within the regulatory system (as already started in MiFID I with MTFs introduction) and capture the trading in non-equity instruments such as bonds, structured finance products, emissions allowances and derivatives currently not conducted via RMs and MTFs.  Organized Trading Facilities are multilateral systems with characteristics that distinguish them from RMs and MTFs. Like RMs and MTFs, OTFs may not execute orders against proprietary capital (except trading in sovereign bonds). In contrast a firm operating on an OTF can exercise discretion when deciding to place or retract an order on the OTF they operate and subject to certain requirements when deciding not to match client orders.

MiFID II increases market transparency by ruling the practice of trading in shares admitted to trading on an RM or traded on an MTF only on an RM, MTF, Systematic Internalizers (SIs) or equivalent third-country trading venue and by forcing derivatives[1] trading on trading venues decreasing the OTC execution.

Pre- and post-trade transparency requirements have been extended to non-equity instruments (i.e. bonds, structured finance products and derivatives) and equity like instruments under MiFID II. As a result of these extended transparency requirements, more information will be available to the public on trading in financial instruments both pre-execution (quotes and pricing) and post-execution. The regulator has also demanded more reporting requirements by expanding the transaction reporting regime, both on the scope of financial instruments captured and on the data fields to include in the report (up to 65 fields).

Algorithmic trading in the new trading landscape: an unavoidable future to be monitored and controlled

There have been many so-called “flash-crashes” during the last decade caused by the activity of algorithmic trading. Michael Lewis in “Flash Boys” describes the father of all these events that occurred in the Dow Jones market on May 6, 2010. The Dow Jones collapsed and rebounded very rapidly losing immediately a thousand points, almost 10%, sending market operators into panic. The movement was caused by a single order of futures on the S&P 500 index that triggered sell algorithms and generated a rapid decline and recovery in the price of financial instruments.

Fostering trading activity on electronic trading venues is a way to spread transparency and financial stability. Regulators are aware that algorithmic trading activity, that limits or excludes human intervention[2], could be a threat for orderly trading conditions as it could generate market abuse and manipulation. For these reasons, MiFID II introduces new requirements to ensure that investment firm will be able to control and monitor their algorithmic trading activity. The Directive considers the benefits of improved trading technology but acknowledges that such strategies, particularly of the HFT variety, give rise to potential risks that could lead to disorderly markets or be used for abusive purposes and therefore must be strictly monitored and regulated.

The algorithmic trading activity could be engaged by an investment firm to generate:

  • orders for proprietary trading, including bid-ask quotes published for the market making activity;
  • orders on behalf of a client, especially to execute an high size order with TWAP[3] or VWAP[4] functionalities, and implement one or more of the following strategies: market making or liquidity providing, hedging or arbitrage.

The most common trading strategy in scope of algorithmic trading for investment firms is the market making activity, because bid-ask quotes are generated automatically during the trading day and published continuously on trading venues. Moreover, an investment firm sometimes develops proprietary market adapters to generate orders on the trading venues with their own algorithms, other times it uses provider’s platform to pursue trading algorithmic technique and algorithms could be:

  • embedded in provider’s trading platform;
  • developed by the investment firm in dedicated spaces made available by the supplier;
  • elaborated by the supplier according to investment firm’s needs.

Additionally, MiFID II defines high frequency trading (HFT) as a subset of algorithmic trading characterized simultaneously by:

  • infrastructure intended to minimize network and other types of latencies, including at least co-location, proximity hosting or high-speed direct electronic access;
  • order initiation, generation, routing or execution without human intervention;
  • high message intraday rates which constitute orders, quotes or cancellations. The rates are evaluated monthly with a moving average according to all messages sent during the previous year considering only proprietary trading (and including market making quotes).

MiFID II requires firms understand the impact their algorithms will have on the marketplace, including the reaction of other algorithms active in the segment. MiFID II requires all trading firms to certify that their algorithms have been tested to ensure that they do not create or contribute to disorderly trading conditions before being deployed in live markets. New requirements for investment firms engaged in algorithmic trading are:

  • general organizational requirements: formalization of specific governance arrangements about trading systems and algorithms proportionate to the nature, scale and complexity of the activity;
  • algorithms pre-deployment requirements: investment firms are required to establish a written procedure for developing, modifying, testing and deploying an algorithm in the production environment;
  • algorithms post-deployment requirements: investment firms have to structure means and controls to ensure resilience of trading systems and algorithms during the trading activity. The functionalities an investment firm has to develop are:
    1. the kill functionality to ensure the cancellation of any or all of unexecuted orders submitted to any or all trading venues to which the investment firm is connected;
    2. the automated surveillance system to detect market abuse;
    3. business continuity arrangements;
    4. the pre-trade controls on price, message limits, order values and volumes to prevent the transmission of wrong orders or quotes to trading venues;
    5. the real time monitoring with real time alerts to assist traders during the trading activity;
    6. the post trade controls to identify algorithms or systems which are not working in the correct way;
    7. cyber security arrangements;
  • periodic requirements: investment firms have to self-assess annually their algorithmic trading activity and consequently the risk management function has to draw up a validation report.

HFTs firms have more strictly requirements because they need the authorization to operate as investment firms and have to store accurate and time sequenced records of all its placed orders and quotes using a defined format (also algo traders have to record all this information, but they are not obliged to use the format set out in the regulation).

Final conclusions

One of MiFID II aim is to create more efficient financial instruments order execution in price-competitive, transparent and stable markets. The innovations in trading venues is a mechanism to strengthen also investor protections. From this perspective, not only where but also how investment firms carry on the trading activity needs to have appropriate organizational and IT arrangements. The MiFID II framework regulates algorithmic trading activity because freedom could create damages to the economic system just because an automated mechanism could go crazy for distressed information. All investment firms have to understand and copy with technological challenge to ensure their algo trading activity is sound, efficient and secure. Will the new requirements prevent algorithmic trading, especially HFT, to generate other cases of flash crash? How many algo traders will qualify their activity as high frequency trading? We will find out soon.

Alessandro Mastrantuono – Director Deloitte Consulting
Gabriele Bonini – Manager Deloitte Consulting
Valeria Mij – Manager Deloitte Consulting
Francesco Ciarambino – Analyst Deloitte Consulting


Notes

[1] ESMA’s Final report (ESMA70-156-227) provides details to derivatives subject to new trading obligations (intragroup transactions are exempt from this trading obligation)

[2] MiFID II defines algorithmic trading as “the trading activity in financial instruments on a trading venue where a computer algorithm automatically determines individual parameters of orders (including quotes) such as whether to initiate the order, the timing, price or quantity of the order or how to manage the order after its submission, with limited or no human intervention”

[3] Time weighted average price (TWAP) strategy breaks up a large order into child orders and execute them close to the average price between the start and end times.

[4] Volume weighted average price (VWAP) strategy breaks up a large order into child orders and execute them close to the average price weighted by volume between the start and end times.


Fintech and banking: today and tomorrow

Mag 14 2018

The deputy governor of the Bank of Italy Fabio Panetta spoke about Fintech developement in the European Union. The definition of “Fintech” comes from the Financial Stability Board: Fintech refers to any “technologically enabled financial innovation that could result in new business models, applications, processes or products with an associated material effect on financial markets and institutions and the provision of financial services.

We observe at the same time Fintech start-ups gaining market shares in specific business lines thanks to aggressive pricing policies, many banks have either established strategic partnerships with them or have taken them over. This way, banks are integrating fintech services into their value chains in order to support their digital plans.

While Fintech start-ups are gaining market shares in specific business lines thanks to aggressive pricing policies, many banks have either established strategic partnerships with them or have taken them over. This way, banks are integrating fintech services into their value chains in order to support their digital plans.

Together with Fintech, it comes cyber risk, which can cause enormous damages. In 2017, the spread of two pieces of malicious
software called WannaCry and NotPetya led to losses in the hundreds of millions of dollars for their high-profile victims, which include the British National Health Service and shipping giant Moller-Maersk of Denmark.

First, it should guarantee a level playing field, in order to avoid regulatory arbitrage and distortions. Regulation should remain tech-neutral, treating the intermediaries that deliver the same services in the same way. Second, given the rapid change that will affect the fintech sector in the future as well, regulation and supervision should be flexible, in order to encourage innovative projects and to avoid any obstacles to the changes that are also likely to affect the supply of technology-intensive
services in the future. Third, a true level playing field would require financial sector authorities within each country – such as bank and insurance supervisors, market authorities, etc. – to cooperate with one another and with regulators in other fields such as data protection, cyber risk, and antitrust. But the spread of these new technologies and the availability of ever more comprehensive information on individuals raises broader and more fundamental questions.

Technology is creating the “technological unemployment” that had been foreseen by Keynes already and is one of the factors further exacerbating income and wealth inequality in both advanced countries and emerging market economies. It also raises the issue of how to guarantee confidentiality in relation to Big Data, how to use it within the limits imposed both by the rules and by the will of our citizens, whose right to privacy must in any case be upheld. We must better define both the legal and ethical limits on the use of Big Data: recent events in connection with Cambridge Analytica and Facebook have sounded the alarm.

Fintech and banking: today and tomorrow (PDF)

Basel Committee: Capital treatment for short-term securitisations

Mag 14 2018

The Basel Committee on Banking Supervision today issued the Capital treatment for simple, transparent and comparable short-term securitisations. This standard supplements the Criteria for identifying simple, transparent and comparable short-term securitisations issued jointly with the International Organization of Securities Commissions (IOSCO).

The standard sets out additional guidance and requirements for the purpose of applying preferential regulatory capital treatment for banks acting as investors in or as sponsors of simple, transparent and comparable (STC) short-term securitisations, typically in asset-backed commercial paper (ABCP) structures. The additional guidance and requirements in this standard are consistent with those for STC term securitisations set out in the Committee’s July 2016 revisions of the securitization framework. Provided that the expanded set of STC short-term criteria are met, STC short-term securitisations will receive the same modest reduction in capital requirements as other STC term securitisations.

The standard incorporates feedback collected during the public consultation conducted in July 2017. Changes made include setting the minimum performance history for non-retail and retail exposures at five years and three years, respectively, and clarifying that the provision of credit and liquidity support to the ABCP structure can be performed by more than one entity, subject to certain conditions.

Capital treatment for simple, transparent and comparable short-term securitisations (PDF)


IMF: Volatility Strikes Back

Mag 14 2018

The bouts of volatility in early February and late March that spooked investors were confined to equity markets. Nevertheless, they illustrate the potential for sudden market moves to expose fragilities in the financial system more broadly. With central banks in advanced economies set to normalize their monetary policies just as trade and geopolitical tensions flare up, economic and policy uncertainty may rise and financial conditions may tighten abruptly. All this could lead to a period of renewed volatility. The burst of turbulence early this year was preceded by a long period of calm marked by low economic uncertainty, low interest rates, easy funding conditions, and improving corporate performance, as shown in the October 2017 Global Stability Report.

This extended period of calm led to the increasing popularity of volatility index-linked investment products. One example: investment strategies that involved selling VIX futures in the Chicago Board Options Exchange (CBOE) equity volatility index with the aim of profiting from declines in the index, known as the VIX. The VIX shows the expected level of price fluctuations in the Standard & Poor’s 500 Index of stocks over the next month.

These so-called short VIX strategies were profitable before the early February spike because, although the VIX index was near historic lows, realized volatility in equity markets was even lower. This premium in implied over-realized equity volatility provided steady returns for those selling VIX futures over the past year. But since the period of volatility that has come to be known as the VIX tantrum, this premium has turned negative, suggesting some of these strategies are now less appealing.

The April 2018 Global Financial Stability Report discusses how some of these short VIX strategies contributed to the February volatility spike. Among them, exchange-traded products that had built up significant bets on low volatility, and which were often sold to retail investors, incurred steep losses. More broadly, investors who expected low volatility to persist were forced to reverse their positions and cover losses by taking bets on higher volatility going forward. This sharp shift in positioning may have exacerbated the surge in the VIX.

The good news is that some of these short-VIX strategies, in particular those marketed to retail investors, appear to have been unwound. The bad news is that other strategies predicated on low volatility reportedly remain widespread, particularly among institutional investors. As a result, a more sustained rise in volatility across asset classes may force a broader class of investors to rebalance their portfolios, which could exacerbate declines in prices, especially if those positions employ financial leverage.

Volatility-targeting strategies are still popular and could be vulnerable. These strategies aim to keep the expected volatility of their investment portfolios at a certain target and use leverage to achieve that. However, their size and flexibility to deviate from their targets can vary significantly. Variable annuities and funds that use trading algorithms are apparently more likely to react to a spike in volatility by selling assets, which could exacerbate turbulence, although the exact extent and speed of such rebalancing are unclear.

Regulators and market participants should remain attuned to the risks associated with higher interest rates and greater volatility. They should ensure that financial institutions maintain robust risk management, including through the close monitoring of exposures to asset classes with valuations judged to be stretched.

Policymakers should develop tools to discourage excessive build-up of leverage that could increase market fragility. They should also be mindful of a migration of activities and risks to more opaque segments of the financial system. To address risks related to investment funds’ activities, regulators should endorse a common definition of financial leverage and strengthen supervision of liquidity risk.

(The original article is available at the IMF Blog here).

Risk-reducing and risk-sharing in the EMU

Mag 14 2018

The President of The European Central Bank (ECB) Mario Draghi, hosted at the European University Institute in Florence, tackled the topic of monetary union and its central role in reducing and sharing risks across European countries. The crisis revealed some specific fragilities in the euro area’s construction that so far have not been resolved.

In addressing such issues, Draghi splits the history of the Great Financial Crisis into five different phases. The first phase took place quite homogeneously across all advanced economies, as all of them had a financial sector characterised by a poor risk management and an excessive optimism in the self-repairing power of markets. When the Lehman shock hit, banks exposed to toxic US assets ran into difficulties and some institutions, most of them located in Germany, France and the Netherlands, and were bailed out by their governments. These bailouts did not greatly affect these sovereign borrowers costs, however, thanks largely to the relatively strong fiscal positions of the governments implementing them.

In the second phase, the crisis spread to banks in Spain and Ireland that had similar weaknesses, but were instead overexposed to the collapsing domestic real estate market. The third phase, began when the Greek crisis shattered the impression that public debt was risk-free, triggering a rapid repricing of sovereign risk. These events spread contagion to all sovereigns now perceived as vulnerable by financial markets. Sovereign risk was then transmitted into the domestic banking sector through two channels, namely, banks’ direct exposures to their own governments’ bonds and negative confidence effects.

The fear of possible sovereign defaults had a dramatic effect on confidence in the domestic private sector. Any distinction between firms and banks, and between banks with and without high sovereign exposures, disappeared. In this way, the crisis spreaded to banks that did not have significant exposures either to US sub-prime assets or to domestic real estate, and therefore had not until then needed to be bailed out.

The fourth stage of the crisis was triggered by investors in both Europe and the rest of the world. Faced with a downward growth spiral, many investors reached the conclusion that the only way out for crisis-hit countries, given the institutional design of the euro area, was for them to exit from it. This would, it was believed, allow them to depreciate their currencies and regain monetary sovereignty. The fifth stage of the crisis then followed: the breakdown in monetary policy transmission across the euro area. Interest rates faced by firms and households in vulnerable countries became increasingly divorced from short-term central bank rates, and this posed a profound threat to price stability.

The unfolding of the euro area crisis yielded lessons for the financial sector, for individual countries and for the union as a whole. But the unifying theme was the inability of each of these actors to effectively absorb shocks. In some cases, because of their weaknesses, they even amplified those shocks. And the euro area as a whole was shown to have no public and very little private risk-sharing.

What makes membership of a monetary union work for all its members is a trade-off: what they lose in terms of national stabilisation tools is counterbalanced by new adjustment mechanisms within the currency area. In the United States, which is a relatively well-functioning monetary union, ex post adjustment plays an important role.

Where the euro area and the US differ more is in terms of ex ante risk-sharing – that is, insuring against shocks through financial markets, which plays two key roles in stabilising local economies in a monetary union. The first is by de-linking consumption and income at the local level, which happens through integrated capital markets. The second is by de-linking the capital of local banks from the volume of local credit supply, which happens through retail banking integration. Overall, it is estimated that around 70% of local shocks are smoothed through financial markets in the US, with capital markets absorbing around 45% and credit markets 25%. In the euro area, by contrast, the total figure is just 25%.

This calls for ad-hoc adressed policies: first of all, we need policies that make the financial system more stable, both by increasing the resilience of banks and by completing the banking union and the capital markets union. Secondly, an incomplete framework for bank resolution also deters cross-border integration. When resolution is not fully credible, it can create incentives for national authorities to limit capital and liquidity flows so as to advantage their depositors in the event of a bank failing. But when the new EU resolution framework is completed and working properly, such concerns about depositors should be quietened down.

Furthermore, public sector policies can complement private risk-sharing by increasing economic convergence and thereby building trust among cross-border investors. The crisis showed clearly the potential of some euro area economies to become trapped in bad equilibria. And plainly, as long as this risk exists, it will act as a deterrent to cross-border integration, especially for retail banks that cannot “cut and run” as soon as a recession hits. So, if we are to deepen private risk-sharing, the tail risk of bad equilibria needs to be removed, and replaced by policies that lead to sustainable convergence. This requires action at both the national and euro area levels.

We know that structural reforms boost growth: looking at the last 15 to 20 years, euro area countries with sound economic structures at the outset have shown much higher long-term real growth. However, while sound domestic policies are key to protect countries from market pressure, the crisis showed that, in certain conditions, they may not be enough. Markets tend to be procyclical and can penalise sovereigns that are perceived to be vulnerable, over and above what may be needed to restore a sustainable fiscal path. And this overshooting can harm growth and ultimately worsen fiscal sustainability.

This creates a need for some form of common stabilisation function to prevent countries from diverging too much during crises, as has already been acknowledged with the creation of two European facilities to tackle bad equilibria.One is the ECB’s OMTs, which can be used when there is a threat to euro area price stability and comes with an ESM programme. The other is the ESM itself. But the conditionality attached to its programmes in general also implies procyclical fiscal tightening.

So, we need an additional fiscal instrument to maintain convergence during large shocks, without having to over-burden monetary policy. Its aim would be to provide an extra layer of stabilisation, thereby reinforcing confidence in national policies. It is not conceptually simple to design such an instrument as it should not, among many other complexities, compensate for weaknesses that can and should be addressed by policies and reforms. It is not legally simple because such an instrument should be consistent with the Treaty. It is also certainly not politically simple, regardless of the shape that such an instrument could take: from the provision of supranational public goods – like security, defence or migration – to a fully-fledged fiscal capacity.

But the argument whereby risk-sharing may help to greatly reduce risk, or whereby solidarity, in some specific circumstances, contributes to efficient risk-reduction, is compelling in this case as well, and our work on the design and proper timeframe for such an instrument should continue. The people of Europe have come to know the euro and trust the euro. But they also expect the euro to deliver the stability and prosperity it promised. So our duty, as policymakers, is to return their trust and to address the areas of our union that we all know are incomplete.

Risk-reducing and risk-sharing in our Monetary Union (full speech, HTML)